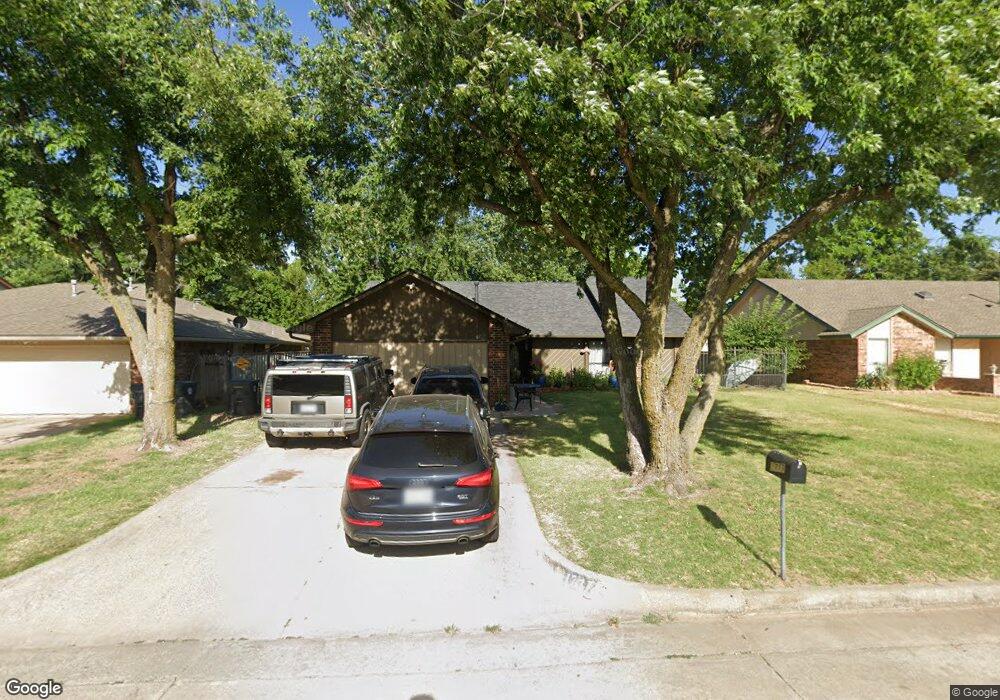
1717 N Gleason Ave Bethany, OK 73008
Estimated Value: $185,000 - $203,000
3
Beds
2
Baths
1,462
Sq Ft
$131/Sq Ft
Est. Value
About This Home
This home is located at 1717 N Gleason Ave, Bethany, OK 73008 and is currently estimated at $190,980, approximately $130 per square foot. 1717 N Gleason Ave is a home located in Oklahoma County with nearby schools including Apollo Elementary School, Mayfield Middle School, and Putnam City West High School.
Ownership History
Date
Name
Owned For
Owner Type
Purchase Details
Closed on
Nov 30, 2007
Sold by
Bullock Debra Jean and Francis E Townsend Trust
Bought by
Acevedo Patricia
Current Estimated Value
Home Financials for this Owner
Home Financials are based on the most recent Mortgage that was taken out on this home.
Original Mortgage
$88,350
Outstanding Balance
$55,835
Interest Rate
6.27%
Mortgage Type
Purchase Money Mortgage
Estimated Equity
$135,145
Purchase Details
Closed on
Nov 28, 2007
Sold by
Acevedo Patricia
Bought by
Bernabe Gabriel E and Campo Rocio O
Home Financials for this Owner
Home Financials are based on the most recent Mortgage that was taken out on this home.
Original Mortgage
$88,350
Outstanding Balance
$55,835
Interest Rate
6.27%
Mortgage Type
Purchase Money Mortgage
Estimated Equity
$135,145
Purchase Details
Closed on
Dec 2, 2003
Sold by
Vu Sa Van and Tran Ty Thi
Bought by
Francis E Townsend Trust
Purchase Details
Closed on
Sep 15, 2003
Sold by
Vu Lisa Phuong and Vanvu Tim Van
Bought by
Vanvu San and Tran Ty Thi
Create a Home Valuation Report for This Property
The Home Valuation Report is an in-depth analysis detailing your home's value as well as a comparison with similar homes in the area
Home Values in the Area
Average Home Value in this Area
Purchase History
| Date | Buyer | Sale Price | Title Company |
|---|---|---|---|
| Acevedo Patricia | $93,000 | Capitol Abstract & Title | |
| Bernabe Gabriel E | -- | Capitol Abstract & Title | |
| Francis E Townsend Trust | $74,000 | Alliance Title Services | |
| Vanvu San | -- | -- |
Source: Public Records
Mortgage History
| Date | Status | Borrower | Loan Amount |
|---|---|---|---|
| Open | Acevedo Patricia | $88,350 |
Source: Public Records
Tax History Compared to Growth
Tax History
| Year | Tax Paid | Tax Assessment Tax Assessment Total Assessment is a certain percentage of the fair market value that is determined by local assessors to be the total taxable value of land and additions on the property. | Land | Improvement |
|---|---|---|---|---|
| 2024 | $1,941 | $16,560 | $2,407 | $14,153 |
| 2023 | $1,941 | $15,772 | $2,420 | $13,352 |
| 2022 | $1,690 | $15,021 | $2,616 | $12,405 |
| 2021 | $1,603 | $14,306 | $2,881 | $11,425 |
| 2020 | $1,521 | $13,625 | $2,277 | $11,348 |
| 2019 | $1,443 | $12,976 | $2,240 | $10,736 |
| 2018 | $1,366 | $12,359 | $0 | $0 |
| 2017 | $1,308 | $11,769 | $2,316 | $9,453 |
| 2016 | $1,253 | $11,439 | $2,316 | $9,123 |
| 2015 | $1,168 | $11,038 | $2,316 | $8,722 |
| 2014 | $1,082 | $10,669 | $2,316 | $8,353 |
Source: Public Records
Map
Nearby Homes
- 2201 N Mueller Ave
- 2117 N Keeton Ave
- 7183 NW 16th St Unit 1/2
- 7115 NW 16th St Unit 7115
- 7111 NW 16th St
- 7123 NW 16th St Unit 7123
- 2305 N Gleason Ave
- 7001 NW 12th St
- 1231 N Chisholm Rd
- 7029 NW 12th St
- 2312 N Donald Ave
- 2112 N Wilburn Ave
- 2104 N Wilburn Ave
- 2317 N Redmond Ave
- 1847 N Allen Ln
- 1925 Melanie Dr
- 1724 N Fordson Ave
- 1609 Kavel Dr
- 2528 Oakridge Dr
- 1630 Kavel Dr
- 1721 N Gleason Ave
- 1725 N Gleason Ave
- 1716 N Gleason Ave
- 1701 N Gleason Ave
- 1712 N Gleason Ave
- 1720 N Gleason Ave
- 1729 N Gleason Ave
- 1700 N Gleason Ave
- 6809 NW 16th St
- 1724 N Gleason Ave
- 1733 N Gleason Ave
- 1732 N Gleason Ave
- 1728 N Gleason Ave
- 6813 NW 16th St
- 6817 NW 16th St
- 1768 Lionsgate Cir
- 1766 Lionsgate Cir
- 1801 N Gleason Ave
- 1770 Lionsgate Cir
- 1772 Lionsgate Cir