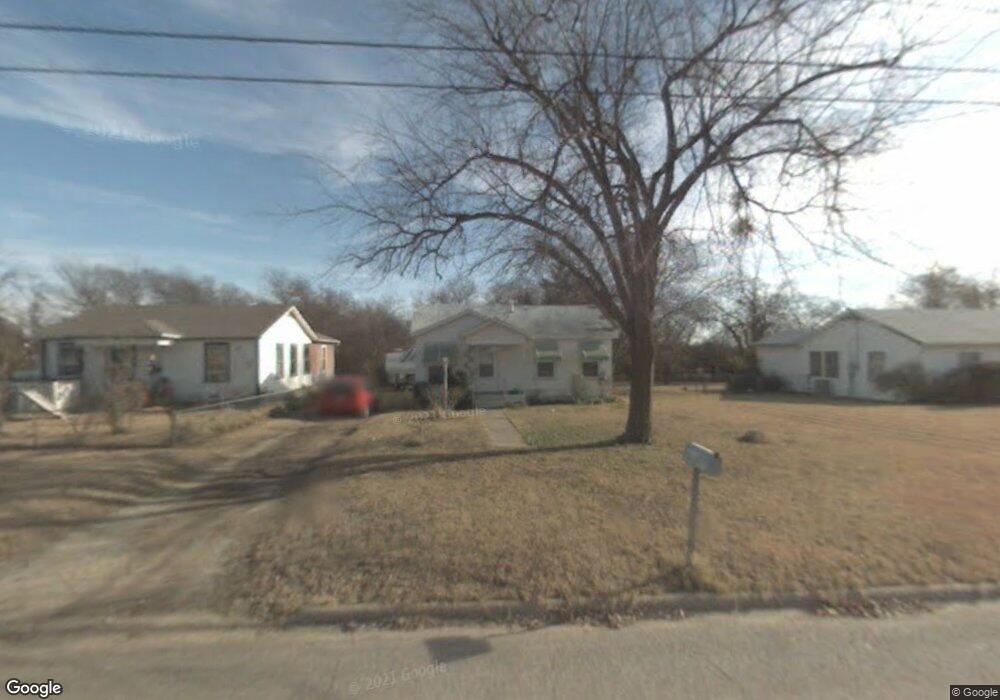
1717 N Hoard Ave Sherman, TX 75090
Estimated Value: $105,143
2
Beds
1
Bath
672
Sq Ft
$156/Sq Ft
Est. Value
About This Home
This home is located at 1717 N Hoard Ave, Sherman, TX 75090 and is currently estimated at $105,143, approximately $156 per square foot. 1717 N Hoard Ave is a home located in Grayson County with nearby schools including Jefferson Elementary School, Dillingham Intermediate School, and Piner Middle School.
Ownership History
Date
Name
Owned For
Owner Type
Purchase Details
Closed on
Feb 21, 2024
Sold by
Christiansen Kimberly
Bought by
Huang Jamy
Current Estimated Value
Purchase Details
Closed on
Feb 20, 2024
Sold by
Bacc Capital Llc
Bought by
Christiansen Kimberly
Purchase Details
Closed on
Feb 28, 2014
Sold by
Starnes Daren and Starnes Diana
Bought by
Vannguyen Hiep Thi
Purchase Details
Closed on
Jul 14, 2006
Sold by
Arnold C Dalton
Bought by
Starnes Daren and Starnes Diana
Home Financials for this Owner
Home Financials are based on the most recent Mortgage that was taken out on this home.
Original Mortgage
$24,000
Interest Rate
6.67%
Mortgage Type
Purchase Money Mortgage
Create a Home Valuation Report for This Property
The Home Valuation Report is an in-depth analysis detailing your home's value as well as a comparison with similar homes in the area
Home Values in the Area
Average Home Value in this Area
Purchase History
| Date | Buyer | Sale Price | Title Company |
|---|---|---|---|
| Huang Jamy | -- | None Listed On Document | |
| Christiansen Kimberly | -- | None Listed On Document | |
| Vannguyen Hiep Thi | -- | Red River Title Co | |
| Starnes Daren | -- | Chapin Title Co Inc |
Source: Public Records
Mortgage History
| Date | Status | Borrower | Loan Amount |
|---|---|---|---|
| Previous Owner | Starnes Daren | $24,000 |
Source: Public Records
Tax History Compared to Growth
Tax History
| Year | Tax Paid | Tax Assessment Tax Assessment Total Assessment is a certain percentage of the fair market value that is determined by local assessors to be the total taxable value of land and additions on the property. | Land | Improvement |
|---|---|---|---|---|
| 2025 | $1,570 | $69,464 | $46,500 | $22,964 |
| 2024 | $1,570 | $71,601 | $45,000 | $26,601 |
| 2023 | $1,641 | $74,735 | $39,375 | $35,360 |
| 2022 | $1,286 | $54,883 | $20,250 | $34,633 |
| 2021 | $977 | $38,994 | $19,500 | $19,494 |
| 2020 | $878 | $33,454 | $12,825 | $20,629 |
| 2019 | $777 | $28,812 | $9,975 | $18,837 |
| 2018 | $678 | $27,015 | $9,375 | $17,640 |
| 2017 | $562 | $22,580 | $5,025 | $17,555 |
| 2016 | $554 | $22,270 | $5,025 | $17,245 |
| 2015 | $535 | $21,545 | $5,025 | $16,520 |
| 2014 | $598 | $24,086 | $5,025 | $19,061 |
Source: Public Records
Map
Nearby Homes
- 1915 E Cole Ave
- 1721 N Hoard Ave
- 1511 N Brents Ave
- 13 E Lewis St
- 1 E Lewis St
- 5 E Lewis St
- 14 E Lewis St
- 1705 E Hilton St
- 2233 E Tuck St
- 1416 N Cleveland Ave
- 2239 E Tuck St
- 1110 N Ross Ave
- 1516 E Peyton St
- 1215 N Grand Ave
- 2700 E Us-82
- 1007 N Cleveland Ave
- 2012 Texoma Pkwy
- 716 N Harrison Ave
- TBD N Cleveland Ave
- 15.125 acres E Peyton St
- 1709 N Hoard Ave
- 1705 N Hoard Ave
- 1720 N Hoard Ave
- 1714 N Hoard Ave
- 1923 E Cole Ave
- 1919 E Cole Ave
- 1921 E Mcreynolds Ave Unit 1919
- 1621 N Hoard Ave
- 2006 E Alma Ave
- 2002 E Alma Ave
- 2010 E Alma Ave
- 1619 N Hoard Ave
- 2014 E Alma Ave
- 000 Peyton
- 1911 E Cole Ave
- 2018 E Alma Ave
- 1624 N Hoard Ave
- 1725 N Brents Ave
- 1721 N Brents Ave
- 1924 E Alma Ave