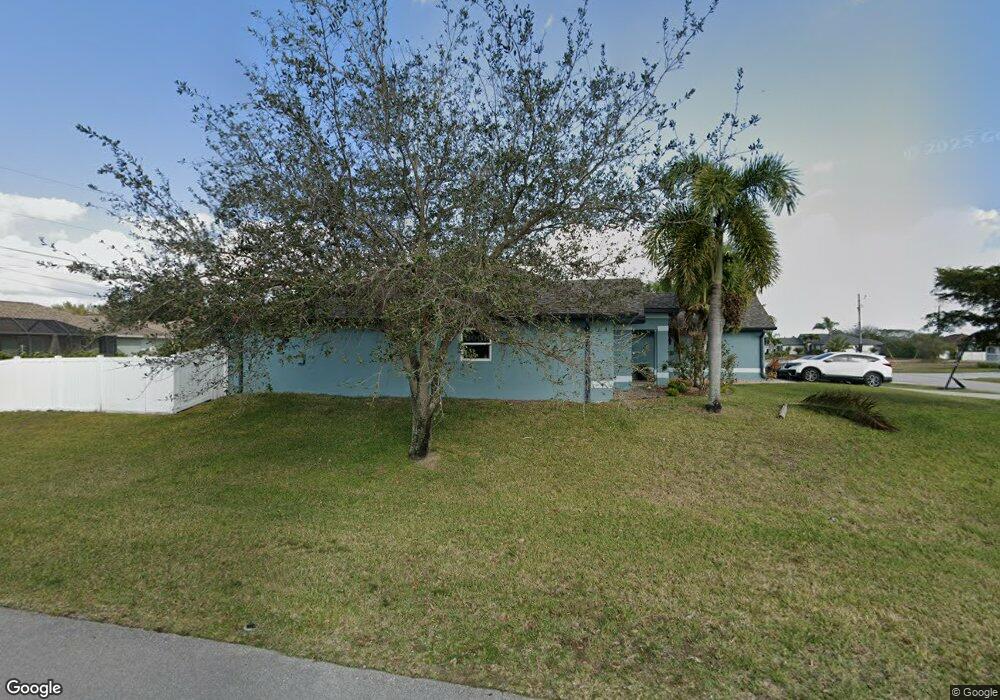
1717 SW 13th St Unit 53 Cape Coral, FL 33991
Trafalgar NeighborhoodEstimated Value: $491,064 - $610,000
4
Beds
2
Baths
2,922
Sq Ft
$185/Sq Ft
Est. Value
About This Home
This home is located at 1717 SW 13th St Unit 53, Cape Coral, FL 33991 and is currently estimated at $540,266, approximately $184 per square foot. 1717 SW 13th St Unit 53 is a home located in Lee County with nearby schools including Caloosa Elementary School, Tropic Isles Elementary School, and Hancock Creek Elementary School.
Ownership History
Date
Name
Owned For
Owner Type
Purchase Details
Closed on
Nov 15, 2024
Sold by
Campbell Robert A and Campbell Alisa J
Bought by
Linares Carlos
Current Estimated Value
Home Financials for this Owner
Home Financials are based on the most recent Mortgage that was taken out on this home.
Original Mortgage
$408,750
Outstanding Balance
$404,681
Interest Rate
6.12%
Mortgage Type
New Conventional
Estimated Equity
$135,585
Purchase Details
Closed on
Mar 5, 2004
Sold by
Adams Homes Of Northwest Florida Inc
Bought by
Campbell Robert A and Campbell Alisa J
Home Financials for this Owner
Home Financials are based on the most recent Mortgage that was taken out on this home.
Original Mortgage
$150,480
Interest Rate
5.53%
Mortgage Type
Unknown
Purchase Details
Closed on
Dec 5, 2001
Sold by
Clerk Circuit Court
Bought by
Cape Holdings Ent Inc
Purchase Details
Closed on
Dec 2, 2000
Sold by
Snyder Edward and Snyder Barbara
Bought by
Josney Corp
Create a Home Valuation Report for This Property
The Home Valuation Report is an in-depth analysis detailing your home's value as well as a comparison with similar homes in the area
Home Values in the Area
Average Home Value in this Area
Purchase History
| Date | Buyer | Sale Price | Title Company |
|---|---|---|---|
| Linares Carlos | $545,000 | Propy Title And Escrow | |
| Linares Carlos | $545,000 | Propy Title And Escrow | |
| Campbell Robert A | $167,200 | Tri County Title Insurance A | |
| Cape Holdings Ent Inc | $2,400 | -- | |
| Josney Corp | $2,300 | -- |
Source: Public Records
Mortgage History
| Date | Status | Borrower | Loan Amount |
|---|---|---|---|
| Open | Linares Carlos | $408,750 | |
| Closed | Linares Carlos | $408,750 | |
| Previous Owner | Campbell Robert A | $150,480 |
Source: Public Records
Tax History Compared to Growth
Tax History
| Year | Tax Paid | Tax Assessment Tax Assessment Total Assessment is a certain percentage of the fair market value that is determined by local assessors to be the total taxable value of land and additions on the property. | Land | Improvement |
|---|---|---|---|---|
| 2025 | $3,707 | $414,665 | $68,638 | $297,017 |
| 2024 | $3,572 | $163,302 | -- | -- |
| 2023 | $3,572 | $158,546 | $0 | $0 |
| 2022 | $3,364 | $153,928 | $0 | $0 |
| 2021 | $3,366 | $269,534 | $35,595 | $233,939 |
| 2020 | $3,375 | $147,382 | $0 | $0 |
| 2019 | $4,541 | $142,283 | $0 | $0 |
| 2018 | $4,497 | $139,630 | $0 | $0 |
| 2017 | $4,450 | $136,758 | $0 | $0 |
| 2016 | $4,389 | $216,228 | $13,464 | $202,764 |
| 2015 | $4,462 | $175,703 | $10,994 | $164,709 |
| 2014 | $4,402 | $184,008 | $10,415 | $173,593 |
| 2013 | -- | $148,092 | $8,478 | $139,614 |
Source: Public Records
Map
Nearby Homes
- 1315 SW 17th Place
- 1214 SW 18th Ave
- 1806 SW 13th St
- 1729 SW 14th St
- 1804 SW 13th Ln
- 1815 SW 13th Ln
- 1416 SW 17th Ave
- 2114 SW 14th Terrace
- 1618 SW 14th St
- 1908 SW 12th Terrace
- 525/531 Chiquita Blvd S
- 1225 Chiquita Blvd S
- 1213 Chiquita Blvd S
- 919 Chiquita Blvd S
- 1423 SW 17th Ave
- 1628 SW 14th St
- 1601 SW 12th Terrace
- 1432 SW 17th Ave
- 1617 SW 15th St
- 1413 SW 19th Place
- 1713 SW 13th St
- 1718 SW 12th Ln
- 1714 SW 12th Ln
- 1714 SW 13th St
- 1709 SW 13th St
- 1222 SW 17th Place
- 1226 SW 17th Place
- 1303 SW 17th Place
- 1305 SW 17th Place
- 1300 SW 17th Place
- 1710 SW 12th Ln
- 1712 SW 13th St
- 1218 SW 17th Place
- 1304 SW 17th Place
- 1309 SW 17th Place
- 1706 SW 12th Ln
- 1304 SW 17 Ave
- 1304 SW 17th Ave
- 1237 SW 18th Ave
- 1233 SW 18th Ave