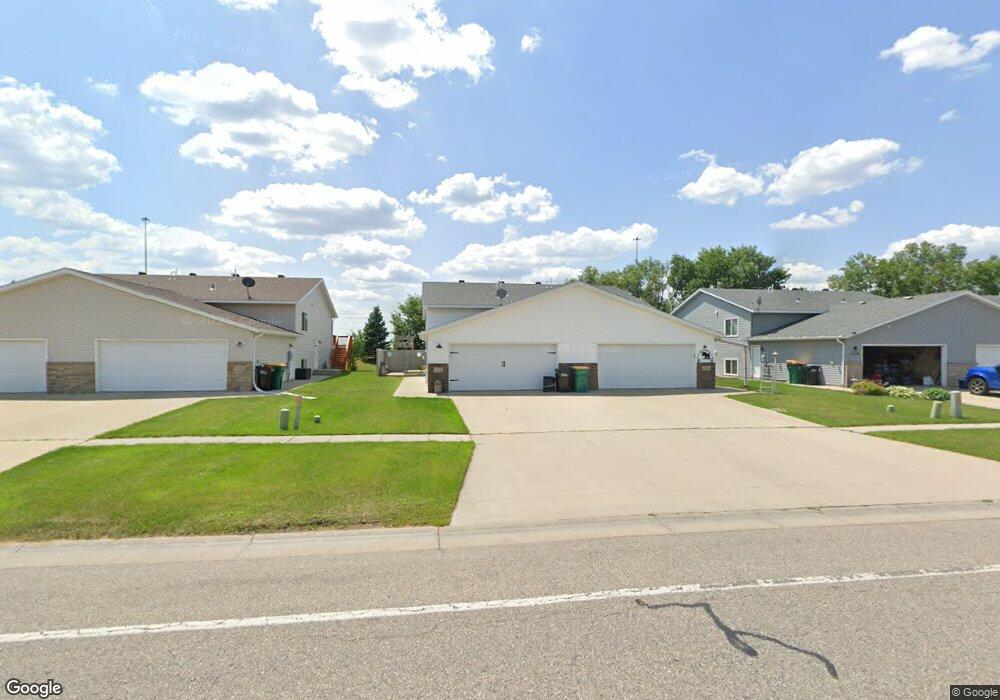
1718 10th St W West Fargo, ND 58078
Elmwood Court NeighborhoodEstimated Value: $259,236 - $266,000
3
Beds
2
Baths
1,672
Sq Ft
$157/Sq Ft
Est. Value
About This Home
This home is located at 1718 10th St W, West Fargo, ND 58078 and is currently estimated at $262,618, approximately $157 per square foot. 1718 10th St W is a home located in Cass County with nearby schools including Westside Elementary School, Cheney Middle School, and West Fargo High School.
Ownership History
Date
Name
Owned For
Owner Type
Purchase Details
Closed on
Oct 26, 2018
Sold by
Dauer Brett W and Beneke Lauren
Bought by
Nelson Jason W
Current Estimated Value
Purchase Details
Closed on
Aug 15, 2016
Sold by
Dauer Brett W
Bought by
Dauer Brett W and Beneke Lauren
Home Financials for this Owner
Home Financials are based on the most recent Mortgage that was taken out on this home.
Original Mortgage
$116,000
Interest Rate
3.42%
Mortgage Type
New Conventional
Purchase Details
Closed on
May 4, 2010
Sold by
Blomquist Erik J
Bought by
Dauer Brett W
Home Financials for this Owner
Home Financials are based on the most recent Mortgage that was taken out on this home.
Original Mortgage
$123,717
Interest Rate
5.1%
Mortgage Type
FHA
Purchase Details
Closed on
Jun 20, 2005
Sold by
Ltd Corp
Bought by
Blomquist Eric J
Home Financials for this Owner
Home Financials are based on the most recent Mortgage that was taken out on this home.
Original Mortgage
$86,650
Interest Rate
5.86%
Mortgage Type
New Conventional
Create a Home Valuation Report for This Property
The Home Valuation Report is an in-depth analysis detailing your home's value as well as a comparison with similar homes in the area
Home Values in the Area
Average Home Value in this Area
Purchase History
| Date | Buyer | Sale Price | Title Company |
|---|---|---|---|
| Nelson Jason W | $170,000 | Title Co | |
| Dauer Brett W | -- | None Available | |
| Dauer Brett W | -- | -- | |
| Blomquist Eric J | $108,350 | -- |
Source: Public Records
Mortgage History
| Date | Status | Borrower | Loan Amount |
|---|---|---|---|
| Previous Owner | Dauer Brett W | $116,000 | |
| Previous Owner | Dauer Brett W | $123,717 | |
| Previous Owner | Blomquist Eric J | $86,650 |
Source: Public Records
Tax History Compared to Growth
Tax History
| Year | Tax Paid | Tax Assessment Tax Assessment Total Assessment is a certain percentage of the fair market value that is determined by local assessors to be the total taxable value of land and additions on the property. | Land | Improvement |
|---|---|---|---|---|
| 2024 | $3,445 | $115,450 | $19,550 | $95,900 |
| 2023 | $3,365 | $112,450 | $19,550 | $92,900 |
| 2022 | $3,229 | $102,900 | $19,550 | $83,350 |
| 2021 | $3,165 | $93,550 | $15,650 | $77,900 |
| 2020 | $2,995 | $89,950 | $15,650 | $74,300 |
| 2019 | $2,799 | $87,400 | $15,650 | $71,750 |
| 2018 | $3,165 | $87,400 | $15,650 | $71,750 |
| 2017 | $3,140 | $84,600 | $15,650 | $68,950 |
| 2016 | $2,893 | $81,900 | $15,650 | $66,250 |
| 2015 | $2,779 | $69,550 | $5,050 | $64,500 |
| 2014 | $2,774 | $65,000 | $5,050 | $59,950 |
| 2013 | $2,689 | $63,250 | $5,050 | $58,200 |
Source: Public Records
Map
Nearby Homes