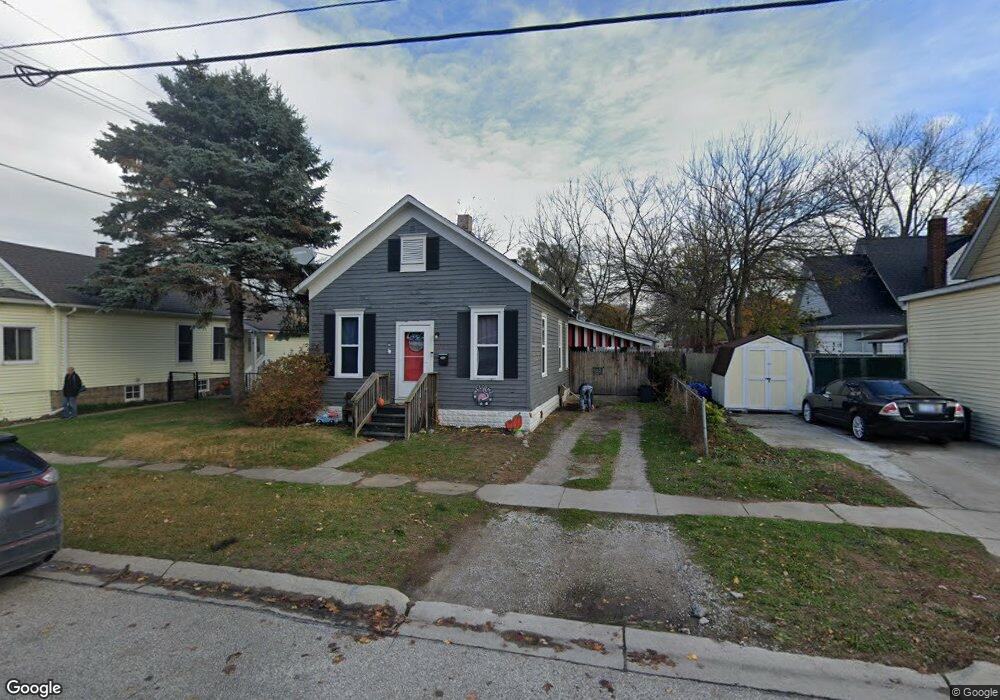
1718 8th St Port Huron, MI 48060
Estimated Value: $79,000 - $93,097
3
Beds
1
Bath
1,144
Sq Ft
$75/Sq Ft
Est. Value
About This Home
This home is located at 1718 8th St, Port Huron, MI 48060 and is currently estimated at $86,024, approximately $75 per square foot. 1718 8th St is a home located in St. Clair County with nearby schools including Woodrow Wilson Elementary School, Central Middle School, and Port Huron High School.
Ownership History
Date
Name
Owned For
Owner Type
Purchase Details
Closed on
Apr 28, 2022
Sold by
Cooney Cara M
Bought by
Rock Kayla A
Current Estimated Value
Home Financials for this Owner
Home Financials are based on the most recent Mortgage that was taken out on this home.
Original Mortgage
$58,913
Outstanding Balance
$55,890
Interest Rate
5.1%
Mortgage Type
FHA
Estimated Equity
$30,134
Purchase Details
Closed on
Feb 22, 2000
Sold by
Vogler Cara M and Voglar Cara M
Bought by
Us Bank National Association
Create a Home Valuation Report for This Property
The Home Valuation Report is an in-depth analysis detailing your home's value as well as a comparison with similar homes in the area
Home Values in the Area
Average Home Value in this Area
Purchase History
| Date | Buyer | Sale Price | Title Company |
|---|---|---|---|
| Rock Kayla A | $60,000 | Fidelity National Title | |
| Us Bank National Association | $55,875 | None Available |
Source: Public Records
Mortgage History
| Date | Status | Borrower | Loan Amount |
|---|---|---|---|
| Open | Rock Kayla A | $58,913 |
Source: Public Records
Tax History Compared to Growth
Tax History
| Year | Tax Paid | Tax Assessment Tax Assessment Total Assessment is a certain percentage of the fair market value that is determined by local assessors to be the total taxable value of land and additions on the property. | Land | Improvement |
|---|---|---|---|---|
| 2025 | $1,939 | $43,400 | $0 | $0 |
| 2024 | $1,634 | $42,000 | $0 | $0 |
| 2023 | $1,543 | $37,100 | $0 | $0 |
| 2022 | $985 | $37,400 | $0 | $0 |
| 2021 | $1,314 | $32,100 | $0 | $0 |
| 2020 | $1,319 | $28,500 | $28,500 | $0 |
| 2019 | $1,356 | $20,200 | $0 | $0 |
| 2018 | $1,267 | $20,200 | $0 | $0 |
| 2016 | $1,029 | $19,100 | $0 | $0 |
| 2015 | $1,082 | $19,100 | $19,100 | $0 |
| 2014 | $1,082 | $20,100 | $20,100 | $0 |
| 2013 | -- | $22,000 | $0 | $0 |
Source: Public Records
Map
Nearby Homes