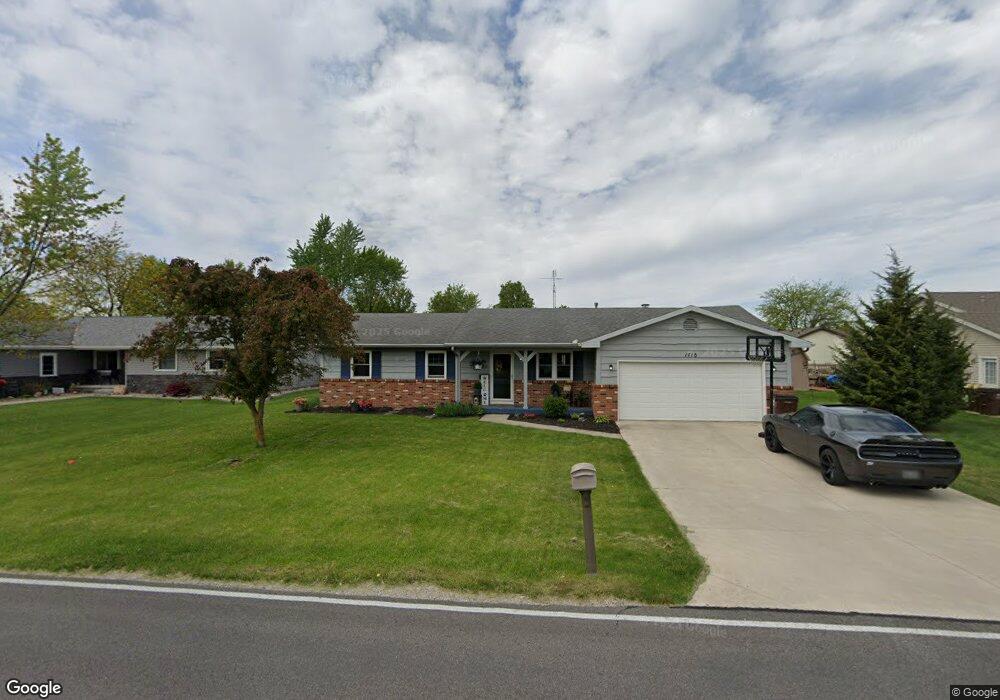
1718 Ginter Rd Defiance, OH 43512
Estimated Value: $204,877 - $230,000
3
Beds
2
Baths
1,324
Sq Ft
$167/Sq Ft
Est. Value
About This Home
This home is located at 1718 Ginter Rd, Defiance, OH 43512 and is currently estimated at $220,469, approximately $166 per square foot. 1718 Ginter Rd is a home located in Defiance County with nearby schools including Defiance Elementary School, Defiance Middle School, and Defiance High School.
Ownership History
Date
Name
Owned For
Owner Type
Purchase Details
Closed on
Apr 30, 2021
Sold by
Miller Steven C and Miller Crystal
Bought by
Fogle Valerie
Current Estimated Value
Home Financials for this Owner
Home Financials are based on the most recent Mortgage that was taken out on this home.
Original Mortgage
$156,750
Outstanding Balance
$141,833
Interest Rate
3%
Mortgage Type
New Conventional
Estimated Equity
$78,636
Purchase Details
Closed on
May 20, 2014
Sold by
Kochensparger Barbara J
Bought by
Miller Douglas M and Miller Shawn D
Purchase Details
Closed on
Apr 23, 2012
Sold by
Ward Royal W and Ward Teresa
Bought by
Kochensparger Barbara J
Purchase Details
Closed on
Jan 1, 1999
Bought by
Miller Douglas M
Purchase Details
Closed on
Dec 24, 1998
Bought by
Miller Douglas M
Create a Home Valuation Report for This Property
The Home Valuation Report is an in-depth analysis detailing your home's value as well as a comparison with similar homes in the area
Home Values in the Area
Average Home Value in this Area
Purchase History
| Date | Buyer | Sale Price | Title Company |
|---|---|---|---|
| Fogle Valerie | $165,000 | None Available | |
| Miller Douglas M | -- | None Available | |
| Kochensparger Barbara J | -- | None Available | |
| Miller Douglas M | -- | -- | |
| Miller Douglas M | -- | -- |
Source: Public Records
Mortgage History
| Date | Status | Borrower | Loan Amount |
|---|---|---|---|
| Open | Fogle Valerie | $156,750 |
Source: Public Records
Tax History Compared to Growth
Tax History
| Year | Tax Paid | Tax Assessment Tax Assessment Total Assessment is a certain percentage of the fair market value that is determined by local assessors to be the total taxable value of land and additions on the property. | Land | Improvement |
|---|---|---|---|---|
| 2024 | $2,134 | $55,400 | $4,860 | $50,540 |
| 2023 | $2,134 | $55,400 | $4,860 | $50,540 |
| 2022 | $1,674 | $38,830 | $4,860 | $33,970 |
| 2021 | $1,674 | $38,830 | $4,860 | $33,970 |
| 2020 | $1,274 | $38,830 | $4,860 | $33,970 |
| 2019 | $1,106 | $34,270 | $4,870 | $29,400 |
| 2018 | $1,075 | $34,270 | $4,870 | $29,400 |
| 2017 | $1,061 | $34,272 | $4,872 | $29,400 |
| 2016 | $1,014 | $32,414 | $4,788 | $27,626 |
| 2015 | -- | $32,414 | $4,788 | $27,626 |
| 2014 | -- | $32,414 | $4,788 | $27,626 |
| 2013 | -- | $32,414 | $4,788 | $27,626 |
| 2012 | -- | $32,414 | $4,788 | $27,626 |
Source: Public Records
Map
Nearby Homes
- 1819 Sherwood Dr
- 1839 Sherwood Dr
- 1963 Sherwood Dr
- 0 Jasica Ct
- 786 Miami Dr
- 156 Cleveland Ave
- 00 Melody Ln
- 130 W Pinewood Ave
- 1101 Jefferson Ave
- 1211 Powell View Dr
- 1623 Evan Dr
- 1673 Evan Dr
- 1528 Terrawenda Dr
- 951 Grove St
- 1473 Lee Ann Ave
- 1509 Lee Ann Ave
- 1515 Lee Ann Ave
- 1492 Lee Ann Ave
- Elements 2200 Plan at Plummer Second Addition
- integrity 2280 Plan at Plummer Second Addition
- 1726 Ginter Rd
- 1710 Ginter Rd
- 1717 Delaware Ct
- 519 Chippewa Dr
- 1740 Ginter Rd
- 1729 Ginter Rd
- 500 Chippewa Dr
- 1748 Ginter Rd
- 1741 Ginter Rd
- 518 Chippewa Dr
- 1656 Jefferson Ave
- 530 Chippewa Dr
- 1741 Delaware Ct
- 553 Chippewa Dr
- 1707 Tiffin Dr
- 1700 Ginter Rd
- 1756 Ginter Rd
- 1718 Delaware Ct
- 1755-1757 Iroquois Ct
- 546 Chippewa Dr