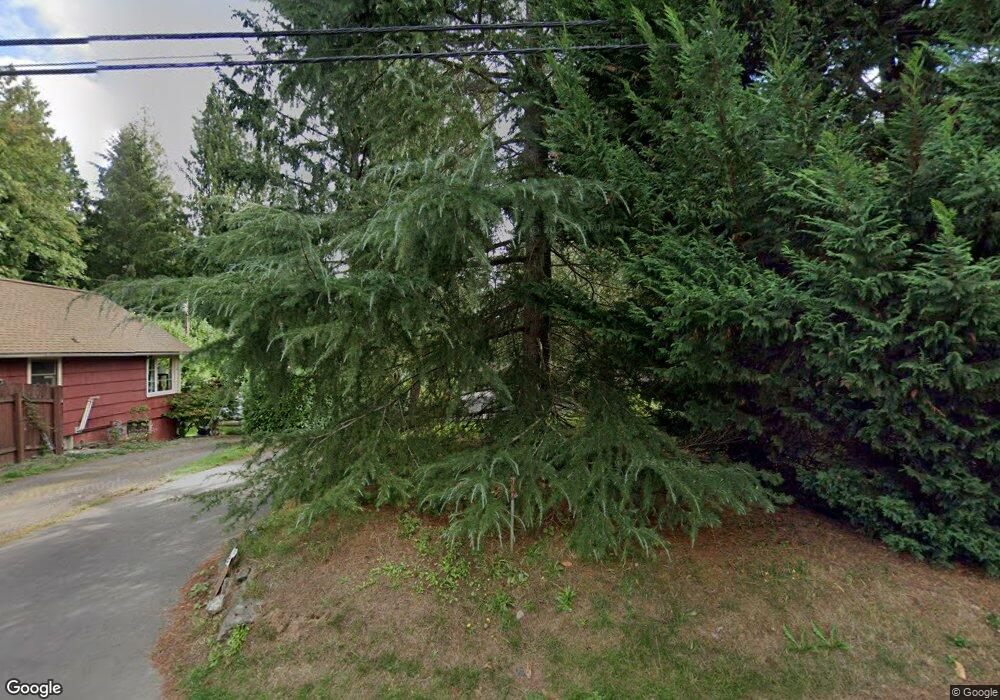
1718 Kitsap Lake Rd NW Bremerton, WA 98312
Estimated Value: $837,000 - $1,011,000
5
Beds
2
Baths
1,481
Sq Ft
$640/Sq Ft
Est. Value
About This Home
This home is located at 1718 Kitsap Lake Rd NW, Bremerton, WA 98312 and is currently estimated at $947,784, approximately $639 per square foot. 1718 Kitsap Lake Rd NW is a home located in Kitsap County with nearby schools including Kitsap Lake Elementary School, Mountain View Middle School, and Bremerton High School.
Ownership History
Date
Name
Owned For
Owner Type
Purchase Details
Closed on
Aug 27, 2007
Sold by
Pappas Michael A and Pappas Sheila G
Bought by
Beasley Marilyn I
Current Estimated Value
Home Financials for this Owner
Home Financials are based on the most recent Mortgage that was taken out on this home.
Original Mortgage
$300,000
Outstanding Balance
$191,588
Interest Rate
6.74%
Mortgage Type
Purchase Money Mortgage
Estimated Equity
$756,196
Purchase Details
Closed on
Feb 21, 1995
Sold by
Benshoff Edward L
Bought by
Pappas Michael A and Pappas Sheila G
Home Financials for this Owner
Home Financials are based on the most recent Mortgage that was taken out on this home.
Original Mortgage
$195,750
Interest Rate
9.23%
Create a Home Valuation Report for This Property
The Home Valuation Report is an in-depth analysis detailing your home's value as well as a comparison with similar homes in the area
Home Values in the Area
Average Home Value in this Area
Purchase History
| Date | Buyer | Sale Price | Title Company |
|---|---|---|---|
| Beasley Marilyn I | $730,280 | Land Title Company | |
| Beasley Marilyn I | -- | Land Title Company | |
| Pappas Michael A | $217,500 | Charter Title Corp |
Source: Public Records
Mortgage History
| Date | Status | Borrower | Loan Amount |
|---|---|---|---|
| Open | Beasley Marilyn I | $300,000 | |
| Previous Owner | Pappas Michael A | $195,750 |
Source: Public Records
Tax History Compared to Growth
Tax History
| Year | Tax Paid | Tax Assessment Tax Assessment Total Assessment is a certain percentage of the fair market value that is determined by local assessors to be the total taxable value of land and additions on the property. | Land | Improvement |
|---|---|---|---|---|
| 2026 | $7,376 | $836,380 | $377,300 | $459,080 |
| 2025 | $7,376 | $836,380 | $377,300 | $459,080 |
| 2024 | $7,118 | $836,380 | $377,300 | $459,080 |
| 2023 | $6,396 | $727,120 | $327,370 | $399,750 |
| 2022 | $6,065 | $619,880 | $277,430 | $342,450 |
| 2021 | $5,429 | $507,840 | $254,580 | $253,260 |
| 2020 | $4,977 | $465,200 | $232,060 | $233,140 |
| 2019 | $4,397 | $425,850 | $211,280 | $214,570 |
| 2018 | $4,828 | $351,600 | $183,580 | $168,020 |
| 2017 | $4,602 | $351,600 | $183,580 | $168,020 |
| 2016 | $4,626 | $334,550 | $173,180 | $161,370 |
| 2015 | $4,731 | $340,450 | $196,870 | $143,580 |
| 2014 | -- | $312,410 | $179,500 | $132,910 |
| 2013 | -- | $312,410 | $179,500 | $132,910 |
Source: Public Records
Map
Nearby Homes
- 1843 Kitsap Lake Rd NW
- 5059 David Rd NW
- 4000 Country Ln NW
- 6116 Kitsap Way Unit 46D
- 6116 Kitsap Way Unit 47A
- 6006 Osprey Cir
- 6061 Osprey Cir
- 7017 Osprey Cir
- 1362 Carr Blvd
- 3287 Northlake Way NW
- 7010 Cormorant Place
- 3148 Old Sawmill Place NW
- 14 XX Price Rd NW
- 0 Old Sawmill Place NW Unit NWM2348102
- 149 Sereno Circle Dr
- 3935 NW Fairway Ln Unit 2E
- 5311 Beach Dr
- 1180 Dorothy Ave NW
- 3943 NW Fairway Ln
- 5149 NW Viewpoint Ln
- 1746 Kitsap Lake Rd NW
- 1700 Kitsap Lake Rd NW
- 1706 Kitsap Lake Rd NW
- 1748 Kitsap Lake Rd NW
- 1770 Kitsap Lake Rd NW
- 1660 Kitsap Lake Rd NW
- 1646 Kitsap Lake Rd NW
- 1661 Northlake Way NW
- 1630 Kitsap Lake Rd NW
- 1721 Kitsap Lake Rd NW
- 1809 Kitsap Lake Rd NW
- 1610 Kitsap Lake Rd NW
- 1833 Kitsap Lake Rd NW
- 1608 Kitsap Lake Rd NW
- 1823 Kitsap Lake Rd NW
- 1675 Northlake Way NW
- 1839 Kitsap Lake Rd NW
- 1602 Kitsap Lake Rd NW
- 1560 Kitsap Lake Rd NW
- 1873 Kitsap Lake Rd NW