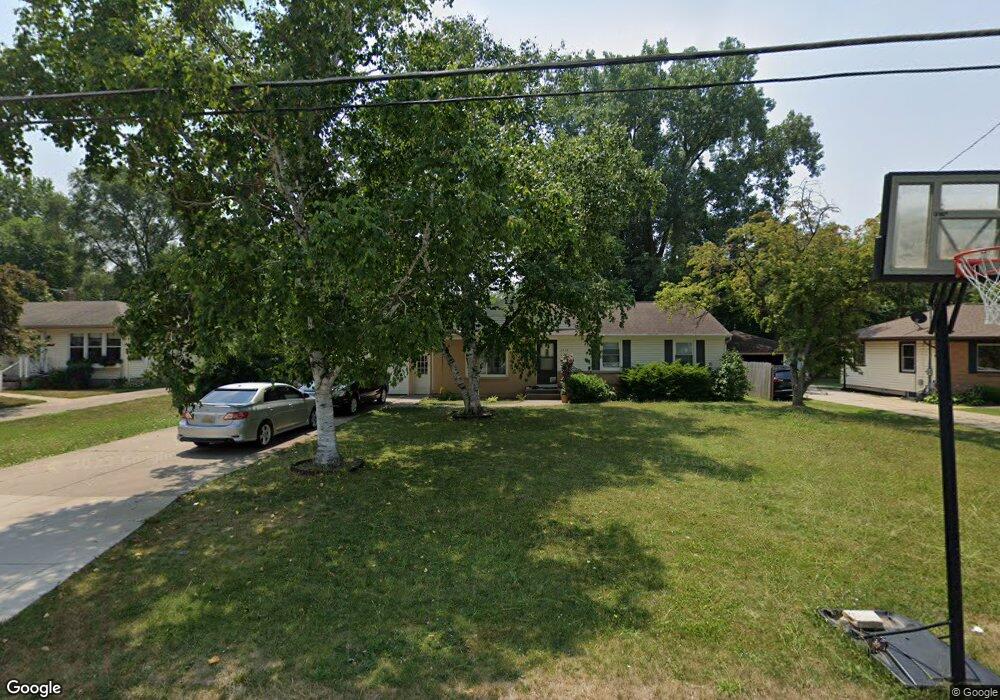
1718 Langley St SE Grand Rapids, MI 49508
Millbrook NeighborhoodEstimated Value: $317,390 - $347,000
4
Beds
3
Baths
2,118
Sq Ft
$158/Sq Ft
Est. Value
About This Home
This home is located at 1718 Langley St SE, Grand Rapids, MI 49508 and is currently estimated at $334,598, approximately $157 per square foot. 1718 Langley St SE is a home located in Kent County with nearby schools including Bowen Elementary, Crestwood Middle School, and East Kentwood High School.
Ownership History
Date
Name
Owned For
Owner Type
Purchase Details
Closed on
Nov 7, 2011
Sold by
Bloom Calvin C and Bloom Jean E
Bought by
Tamang Renu
Current Estimated Value
Home Financials for this Owner
Home Financials are based on the most recent Mortgage that was taken out on this home.
Original Mortgage
$102,338
Outstanding Balance
$69,277
Interest Rate
3.87%
Mortgage Type
FHA
Estimated Equity
$265,321
Purchase Details
Closed on
May 31, 1989
Create a Home Valuation Report for This Property
The Home Valuation Report is an in-depth analysis detailing your home's value as well as a comparison with similar homes in the area
Home Values in the Area
Average Home Value in this Area
Purchase History
| Date | Buyer | Sale Price | Title Company |
|---|---|---|---|
| Tamang Renu | $105,000 | First American Title Ins Co | |
| -- | $79,900 | -- |
Source: Public Records
Mortgage History
| Date | Status | Borrower | Loan Amount |
|---|---|---|---|
| Open | Tamang Renu | $102,338 |
Source: Public Records
Tax History Compared to Growth
Tax History
| Year | Tax Paid | Tax Assessment Tax Assessment Total Assessment is a certain percentage of the fair market value that is determined by local assessors to be the total taxable value of land and additions on the property. | Land | Improvement |
|---|---|---|---|---|
| 2025 | $3,495 | $138,100 | $0 | $0 |
| 2024 | $3,495 | $128,200 | $0 | $0 |
| 2023 | $3,464 | $106,200 | $0 | $0 |
| 2022 | $2,175 | $88,700 | $0 | $0 |
| 2021 | $2,142 | $81,800 | $0 | $0 |
| 2020 | $1,993 | $83,800 | $0 | $0 |
| 2019 | $2,044 | $77,200 | $0 | $0 |
| 2018 | $2,044 | $70,000 | $0 | $0 |
| 2017 | $1,993 | $64,100 | $0 | $0 |
| 2016 | $1,933 | $56,500 | $0 | $0 |
| 2015 | $1,863 | $56,500 | $0 | $0 |
| 2013 | -- | $52,700 | $0 | $0 |
Source: Public Records
Map
Nearby Homes
- 1675 Langley St SE
- 1229 44th St SE
- 4215 Weymouth Dr SE
- 4324 Norman Dr SE Unit 14
- 4331 Kimball Ave SE
- 3826 Kirkshire Dr SE
- 4114 Norman Dr SE
- 3801 E Norwalk Dr SE
- 1563 Amberly Dr SE
- 4690 Stauffer Ave SE
- 3707 Stilesgate Ct SE
- 4761 Kalamazoo Ave SE
- 2018 S Cross Creek Dr SE
- 1903 Whistle Stop Dr SE
- 3635 Dawes Ave SE
- 2138 S Cross Creek Dr SE Unit 127
- 2025 Treeridge Dr SE
- 1836 Eastbrook St SE
- 3854 Pemberton Dr SE Unit 57
- 4178 Eastcastle Ct SE Unit 3
- 1704 Langley St SE
- 1728 Langley St SE
- 4231 Dawes Ct SE
- 4231 Dawes Ct SE Unit 4233
- 4231 Dawes Ct SE Unit 4333
- 1692 Langley St SE
- 1740 Langley St SE
- 4230 Dawes Ct SE
- 1711 Langley St SE
- 1725 Langley St SE
- 4241 Dawes Ct SE
- 4241 Dawes Ct SE Unit 4243
- 1735 Langley St SE
- 1699 Langley St SE
- 4256 Langley Ct SE
- 1682 Langley St SE
- 4254 Langley Ct SE
- 4240 Dawes Ct SE
- 4252 Langley Ct SE Unit 6
- 4233 Plymouth Ave SE