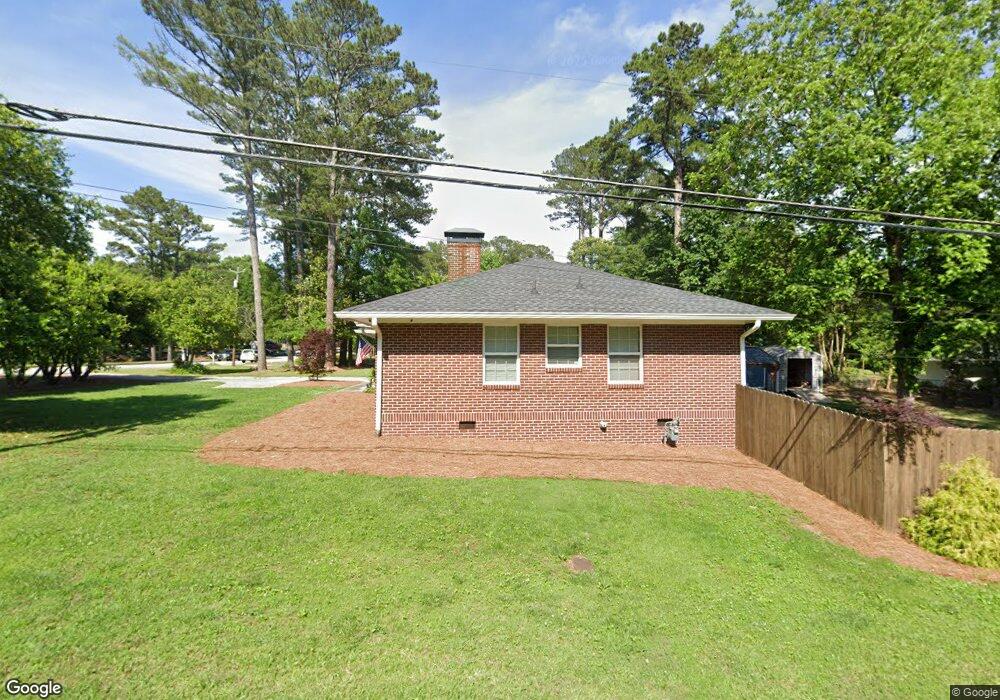
1718 Maple St Carrollton, GA 30117
Estimated Value: $290,000 - $391,998
3
Beds
2
Baths
1,820
Sq Ft
$187/Sq Ft
Est. Value
About This Home
This home is located at 1718 Maple St, Carrollton, GA 30117 and is currently estimated at $340,500, approximately $187 per square foot. 1718 Maple St is a home located in Carroll County with nearby schools including Carrollton Elementary School, Carrollton Upper Elementary School, and Carrollton Middle School.
Ownership History
Date
Name
Owned For
Owner Type
Purchase Details
Closed on
Oct 23, 2025
Sold by
Lovvorn Dana C
Bought by
Lovvorn Rachel Isabella and Edison Jacob Tyler
Current Estimated Value
Purchase Details
Closed on
Jun 28, 2024
Sold by
Wade James Michael
Bought by
Lovvorn Dana C
Purchase Details
Closed on
Aug 3, 2020
Sold by
Harris Linda Sue Estate
Bought by
Wade James Michael
Home Financials for this Owner
Home Financials are based on the most recent Mortgage that was taken out on this home.
Original Mortgage
$102,000
Interest Rate
3%
Mortgage Type
New Conventional
Purchase Details
Closed on
May 20, 2003
Sold by
Cook Sydney J
Bought by
Harris Linda S
Purchase Details
Closed on
Jan 31, 1978
Sold by
Hicks Ricky E
Bought by
Cook Sydney J
Purchase Details
Closed on
Aug 12, 1976
Sold by
Blackwell J Lloyd
Bought by
Hicks Rickey E
Purchase Details
Closed on
Jul 29, 1971
Sold by
Tolbert Harman S
Bought by
Blackwell J Lloyd
Create a Home Valuation Report for This Property
The Home Valuation Report is an in-depth analysis detailing your home's value as well as a comparison with similar homes in the area
Home Values in the Area
Average Home Value in this Area
Purchase History
| Date | Buyer | Sale Price | Title Company |
|---|---|---|---|
| Lovvorn Rachel Isabella | -- | -- | |
| Lovvorn Dana C | $385,000 | -- | |
| Wade James Michael | $127,500 | -- | |
| Harris Linda S | $80,000 | -- | |
| Cook Sydney J | $26,500 | -- | |
| Hicks Rickey E | -- | -- | |
| Blackwell J Lloyd | $30,000 | -- |
Source: Public Records
Mortgage History
| Date | Status | Borrower | Loan Amount |
|---|---|---|---|
| Previous Owner | Wade James Michael | $102,000 |
Source: Public Records
Tax History Compared to Growth
Tax History
| Year | Tax Paid | Tax Assessment Tax Assessment Total Assessment is a certain percentage of the fair market value that is determined by local assessors to be the total taxable value of land and additions on the property. | Land | Improvement |
|---|---|---|---|---|
| 2025 | $3,079 | $116,268 | $20,720 | $95,548 |
| 2024 | $3,177 | $116,268 | $20,720 | $95,548 |
| 2023 | $3,177 | $107,663 | $20,720 | $86,943 |
| 2022 | $2,328 | $79,747 | $20,720 | $59,027 |
| 2021 | $2,081 | $71,273 | $20,720 | $50,553 |
| 2020 | $419 | $66,151 | $20,720 | $45,431 |
| 2019 | $409 | $61,625 | $20,720 | $40,905 |
| 2018 | $1,397 | $56,672 | $20,720 | $35,952 |
| 2017 | $1,402 | $56,672 | $20,720 | $35,952 |
| 2016 | $1,410 | $56,672 | $20,720 | $35,952 |
| 2015 | $818 | $30,485 | $9,300 | $21,186 |
| 2014 | $822 | $30,486 | $9,300 | $21,186 |
Source: Public Records
Map
Nearby Homes
- 223 Sunset Blvd
- 1818 Maple St
- 166 Maple St
- 142 Griffin Dr
- 141 Bowen St
- 30 Lynda Cir
- 105 Haygood Place
- 74 Old Mill Ct
- 308 Old Mill Dr
- 117 Orion Terrace
- 130 Maple Crossing Unit 1
- 130 Maple Crossing Unit LOT 2
- 114 Second St
- 219 Broad St
- 516 Longview St
- 107 Magnolia Ln
- 334 Maple View Dr
- 388 Maple View Dr
- 390 Maple View Dr
- 127 S Ole Hickory Trail
- 1668 Maple St
- 1666 Maple St
- 219 Sunset Blvd
- 301 Sunset Blvd
- 1806 Maple St
- 215 Sunset Blvd
- 305 Sunset Blvd
- 1654 Maple St
- 1810 Maple St
- 209 Sunset Blvd
- 309 Sunset Blvd
- 222 Sunset Blvd
- 218 Sunset Blvd
- 205 Sunset Blvd
- 201 W Club Dr
- 1814 Maple St
- 214 Sunset Blvd
- 315 Sunset Blvd
- 312 Sunset Blvd
- 210 Sunset Blvd