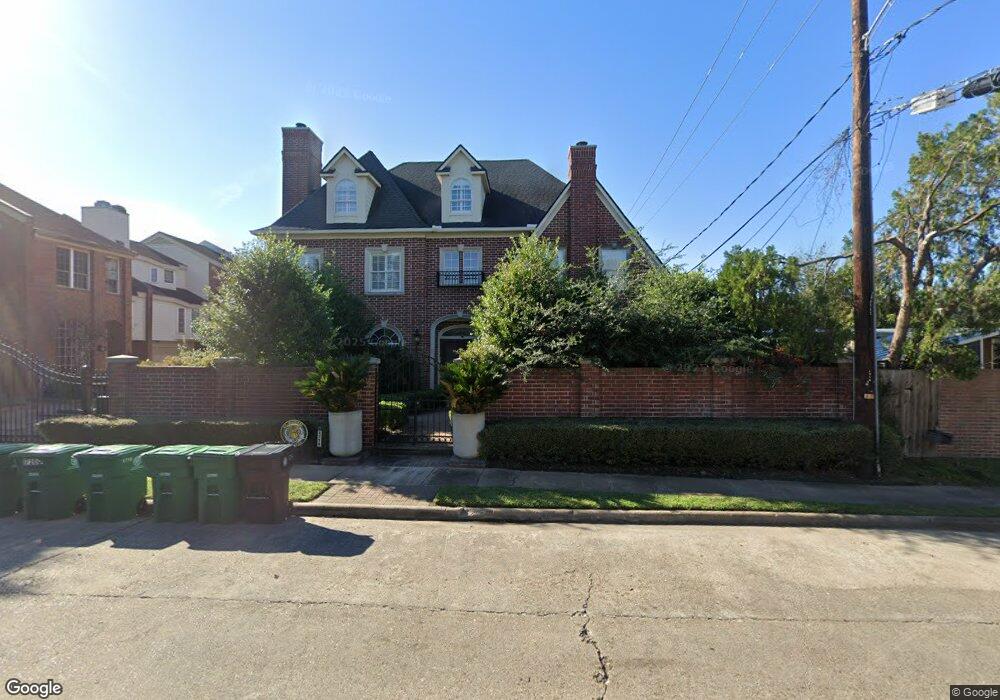
1718 Potomac Dr Unit C Houston, TX 77057
Uptown-Galleria District NeighborhoodEstimated Value: $662,820 - $939,000
4
Beds
5
Baths
3,380
Sq Ft
$229/Sq Ft
Est. Value
About This Home
This home is located at 1718 Potomac Dr Unit C, Houston, TX 77057 and is currently estimated at $773,955, approximately $228 per square foot. 1718 Potomac Dr Unit C is a home located in Harris County with nearby schools including Briargrove Elementary School, Tanglewood Middle, and Wisdom High School.
Ownership History
Date
Name
Owned For
Owner Type
Purchase Details
Closed on
Aug 24, 2018
Sold by
Mccullough John and Mccullough Mollie C
Bought by
Haslam John H and Haslam Katherine Y
Current Estimated Value
Purchase Details
Closed on
Jun 3, 2010
Sold by
Stargel Jack S and Stargel Vicki D
Bought by
Mccullough John and Chaney Mollie
Home Financials for this Owner
Home Financials are based on the most recent Mortgage that was taken out on this home.
Original Mortgage
$400,000
Interest Rate
5%
Mortgage Type
New Conventional
Purchase Details
Closed on
Feb 26, 2001
Sold by
Jensen Torben G and Jensen Lis
Bought by
Stargel Jack S and Stargel Vicki D
Home Financials for this Owner
Home Financials are based on the most recent Mortgage that was taken out on this home.
Original Mortgage
$210,000
Interest Rate
6.97%
Mortgage Type
Balloon
Purchase Details
Closed on
Jul 30, 1998
Sold by
Moster Scott G and Moster Tami
Bought by
Jensen Torben G and Jensen Lis
Create a Home Valuation Report for This Property
The Home Valuation Report is an in-depth analysis detailing your home's value as well as a comparison with similar homes in the area
Home Values in the Area
Average Home Value in this Area
Purchase History
| Date | Buyer | Sale Price | Title Company |
|---|---|---|---|
| Haslam John H | -- | Old Republic Title Insurance | |
| Mccullough John | -- | Etc | |
| Stargel Jack S | -- | Chicago Title Insurance Co | |
| Jensen Torben G | -- | Commonwealth Land Title Co |
Source: Public Records
Mortgage History
| Date | Status | Borrower | Loan Amount |
|---|---|---|---|
| Previous Owner | Mccullough John | $400,000 | |
| Previous Owner | Stargel Jack S | $210,000 |
Source: Public Records
Tax History Compared to Growth
Tax History
| Year | Tax Paid | Tax Assessment Tax Assessment Total Assessment is a certain percentage of the fair market value that is determined by local assessors to be the total taxable value of land and additions on the property. | Land | Improvement |
|---|---|---|---|---|
| 2025 | $4,830 | $675,000 | $155,155 | $519,845 |
| 2024 | $4,830 | $552,028 | $155,155 | $396,873 |
| 2023 | $4,830 | $565,521 | $155,155 | $410,366 |
| 2022 | $13,640 | $619,482 | $155,155 | $464,327 |
| 2021 | $14,543 | $624,000 | $155,155 | $468,845 |
| 2020 | $15,062 | $621,983 | $155,155 | $466,828 |
| 2019 | $16,228 | $660,626 | $155,155 | $505,471 |
| 2018 | $11,559 | $583,000 | $155,155 | $427,845 |
| 2017 | $14,742 | $583,000 | $155,155 | $427,845 |
| 2016 | $14,742 | $583,000 | $155,155 | $427,845 |
| 2015 | $11,349 | $734,349 | $155,155 | $579,194 |
| 2014 | $11,349 | $606,300 | $155,155 | $451,145 |
Source: Public Records
Map
Nearby Homes
- 6007 San Felipe St Unit A
- 6104 San Felipe St
- 1628 Potomac Dr
- 1815 Potomac Dr Unit C
- 5917 San Felipe St
- 1919 Potomac Dr
- 1923 Potomac Dr
- 1616 Fountain View Dr Unit 209
- 1616 Fountain View Dr Unit 509
- 1616 Fountain View Dr Unit 202
- 1616 Fountain View Dr Unit 407
- 6008 Inwood Dr
- 2009 Nantucket Dr
- 1515 Potomac Dr Unit B
- 2113 Potomac Dr Unit D
- 6206 San Felipe St
- 1425 Nantucket Dr Unit D
- 2118 Nantucket Dr Unit C
- 12 Jaime Nuno
- 2117 Nantucket Dr
- 1716 Potomac Dr
- 1716 Potomac Dr Unit B
- 1711 Briarmead Dr
- 1707 Briarmead Dr
- 6105 San Felipe St
- 1714 Potomac Dr
- 1715 Briarmead Dr
- 6103 San Felipe St
- 1720 Potomac Dr
- 1720 Potomac Dr
- 1720 Potomac Dr
- 1720 Potomac Dr
- 1720 Potomac Dr Unit A
- 1720 Potomac Dr Unit D
- 1720 Potomac Dr Unit C
- 1724 Potomac Dr
- 1703 Briarmead Dr
- 6101 San Felipe St
- 1722 Potomac Dr
- 1719 Briarmead Dr