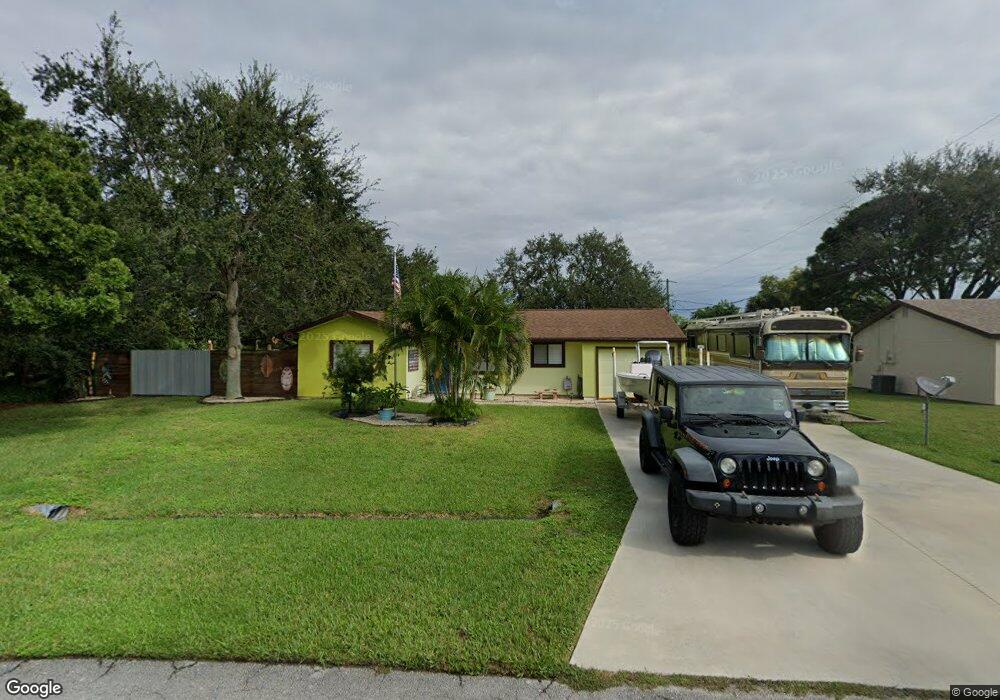
1718 SE Flintlock Rd Port Saint Lucie, FL 34952
Sandhill Crossing NeighborhoodEstimated Value: $273,096 - $300,000
2
Beds
1
Bath
904
Sq Ft
$314/Sq Ft
Est. Value
About This Home
This home is located at 1718 SE Flintlock Rd, Port Saint Lucie, FL 34952 and is currently estimated at $283,524, approximately $313 per square foot. 1718 SE Flintlock Rd is a home located in St. Lucie County with nearby schools including Morningside Elementary School, Mariposa Elementary School, and Floresta Elementary School.
Ownership History
Date
Name
Owned For
Owner Type
Purchase Details
Closed on
Jun 15, 2016
Sold by
Goller Daniel R
Bought by
Leamon Edward C and Leamon Karen A
Current Estimated Value
Home Financials for this Owner
Home Financials are based on the most recent Mortgage that was taken out on this home.
Original Mortgage
$118,795
Outstanding Balance
$94,671
Interest Rate
3.61%
Mortgage Type
VA
Estimated Equity
$188,853
Purchase Details
Closed on
Mar 24, 2011
Sold by
Vargas Juan
Bought by
Goller Daniel R
Purchase Details
Closed on
Aug 31, 2005
Sold by
Mcdonald Robert R and Mcdonald Lois M
Bought by
Vargas Juan
Home Financials for this Owner
Home Financials are based on the most recent Mortgage that was taken out on this home.
Original Mortgage
$122,430
Interest Rate
5.19%
Mortgage Type
Negative Amortization
Purchase Details
Closed on
Feb 15, 2002
Sold by
Mchugh William F and Mchugh Mary M
Bought by
Mcdonald Robert R and Mcdonald Lois M
Create a Home Valuation Report for This Property
The Home Valuation Report is an in-depth analysis detailing your home's value as well as a comparison with similar homes in the area
Home Values in the Area
Average Home Value in this Area
Purchase History
| Date | Buyer | Sale Price | Title Company |
|---|---|---|---|
| Leamon Edward C | $120,000 | Patch Reef Title Co Inc | |
| Goller Daniel R | $36,000 | Ally Parker Brown Title Insu | |
| Vargas Juan | $174,900 | Universal Land Title Inc | |
| Mcdonald Robert R | $60,000 | -- |
Source: Public Records
Mortgage History
| Date | Status | Borrower | Loan Amount |
|---|---|---|---|
| Open | Leamon Edward C | $118,795 | |
| Previous Owner | Vargas Juan | $122,430 |
Source: Public Records
Tax History Compared to Growth
Tax History
| Year | Tax Paid | Tax Assessment Tax Assessment Total Assessment is a certain percentage of the fair market value that is determined by local assessors to be the total taxable value of land and additions on the property. | Land | Improvement |
|---|---|---|---|---|
| 2024 | $1,316 | $69,262 | -- | -- |
| 2023 | $1,316 | $67,245 | $0 | $0 |
| 2022 | $1,248 | $65,287 | $0 | $0 |
| 2021 | $1,169 | $63,386 | $0 | $0 |
| 2020 | $1,176 | $62,511 | $0 | $0 |
| 2019 | $1,180 | $61,106 | $0 | $0 |
| 2018 | $1,137 | $59,967 | $0 | $0 |
| 2017 | $1,135 | $97,300 | $35,700 | $61,600 |
| 2016 | $1,905 | $77,100 | $27,500 | $49,600 |
| 2015 | $1,714 | $58,000 | $18,400 | $39,600 |
| 2014 | $1,488 | $41,250 | $0 | $0 |
Source: Public Records
Map
Nearby Homes
- 2443 SE Tracy Ave
- 2533 SE Grand Dr
- 2373 SE Avalon Rd
- 2349 SE Avalon Rd
- 1614 SE Durango St
- 2448 SE Pascal Ave
- 2442 SE Pascal Ave
- 2430 SE Tiffany Ave
- 1744 SE Berkshire Blvd
- 2433 SE Renick Ave
- 2565 SE Dogwood Ave
- 1682 SE Berkshire Blvd
- 1731 SE Ridgewood St
- 1857 SE Bowie St
- 2492 SE Rival Ave
- 1520 SE Mariana Rd
- 1785 SE Berkshire Blvd
- 1791 Mansfield St
- 1791 SE Mansfield St
- 402 SE Castle Ct Unit B
- 1710 SE Flintlock Rd
- 2450 SE Tracy Ave
- 2438 SE Tracy Ave
- 2462 SE Tracy Ave
- 1698 SE Flintlock Rd
- 1731 SE Flintlock Rd
- 1721 SE Flintlock Rd
- 2474 SE Tracy Ave
- 2486 SE Tracy Ave
- 1741 SE Flintlock Rd
- 2457 SE Tracy Ave
- 1697 SE Flintlock Rd
- 2471 SE Tracy Ave
- 1689 SE Flintlock Rd
- 1751 SE Flintlock Rd
- 1782 SE Mariana Rd
- 1681 SE Flintlock Rd
- 1772 SE Mariana Rd
- 2402 SE Wood Ave