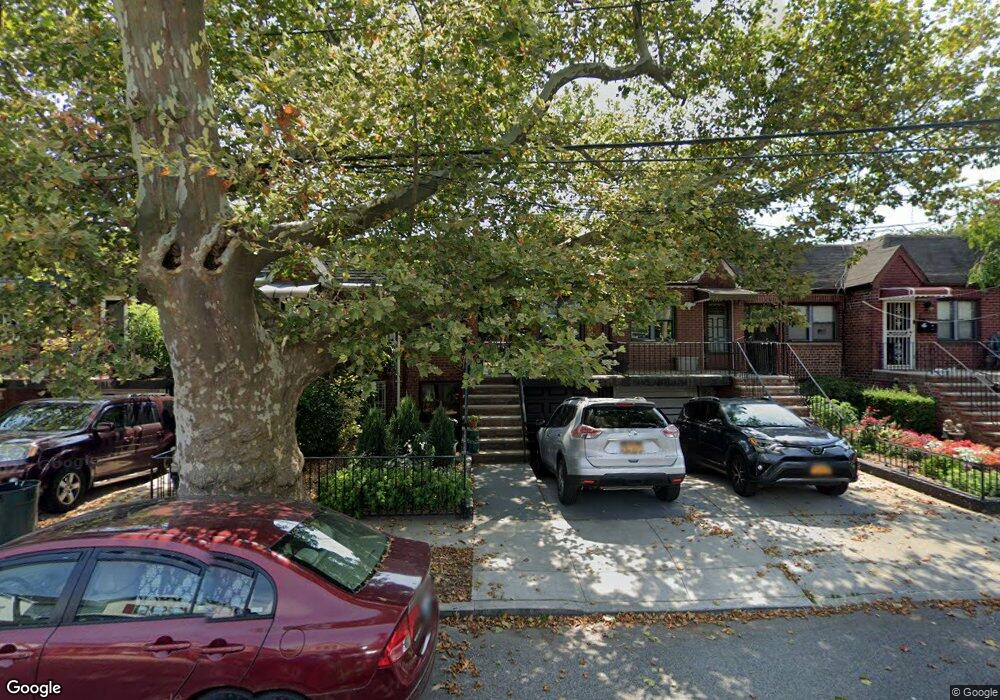
1718 Stuart St Brooklyn, NY 11229
Marine Park NeighborhoodEstimated Value: $689,000 - $1,016,000
2
Beds
1
Bath
1,379
Sq Ft
$616/Sq Ft
Est. Value
About This Home
This home is located at 1718 Stuart St, Brooklyn, NY 11229 and is currently estimated at $849,196, approximately $615 per square foot. 1718 Stuart St is a home located in Kings County with nearby schools including PS 222 Katherine R Snyder, J.H.S. 278 Marine Park, and James Madison High School.
Ownership History
Date
Name
Owned For
Owner Type
Purchase Details
Closed on
Jan 4, 2016
Sold by
Seda Nathalie
Bought by
Cheung Kwai Ching and Lin Cindy
Current Estimated Value
Home Financials for this Owner
Home Financials are based on the most recent Mortgage that was taken out on this home.
Original Mortgage
$336,000
Outstanding Balance
$267,403
Interest Rate
3.98%
Mortgage Type
Purchase Money Mortgage
Estimated Equity
$581,793
Purchase Details
Closed on
Feb 1, 2013
Sold by
Martinez Carmen
Bought by
Seda Nathalie and Seda Ralph
Home Financials for this Owner
Home Financials are based on the most recent Mortgage that was taken out on this home.
Original Mortgage
$412,392
Interest Rate
3.38%
Mortgage Type
New Conventional
Purchase Details
Closed on
Dec 24, 1998
Sold by
Rehill James
Bought by
Rehill James
Home Financials for this Owner
Home Financials are based on the most recent Mortgage that was taken out on this home.
Original Mortgage
$3,911
Interest Rate
7.02%
Create a Home Valuation Report for This Property
The Home Valuation Report is an in-depth analysis detailing your home's value as well as a comparison with similar homes in the area
Home Values in the Area
Average Home Value in this Area
Purchase History
| Date | Buyer | Sale Price | Title Company |
|---|---|---|---|
| Cheung Kwai Ching | $560,000 | -- | |
| Seda Nathalie | $420,000 | -- | |
| Rehill James | -- | -- |
Source: Public Records
Mortgage History
| Date | Status | Borrower | Loan Amount |
|---|---|---|---|
| Open | Cheung Kwai Ching | $336,000 | |
| Previous Owner | Seda Nathalie | $412,392 | |
| Previous Owner | Rehill James | $3,911 | |
| Closed | Rehill James | $10,000 |
Source: Public Records
Tax History
| Year | Tax Paid | Tax Assessment Tax Assessment Total Assessment is a certain percentage of the fair market value that is determined by local assessors to be the total taxable value of land and additions on the property. | Land | Improvement |
|---|---|---|---|---|
| 2025 | $6,664 | $56,400 | $8,400 | $48,000 |
| 2024 | $6,664 | $46,560 | $8,400 | $38,160 |
| 2023 | $6,559 | $53,400 | $8,400 | $45,000 |
| 2022 | $6,336 | $51,060 | $8,400 | $42,660 |
| 2021 | $6,296 | $55,980 | $8,400 | $47,580 |
| 2020 | $6,131 | $39,180 | $8,400 | $30,780 |
| 2019 | $4,251 | $39,180 | $8,400 | $30,780 |
| 2018 | $5,426 | $28,080 | $6,300 | $21,780 |
| 2017 | $5,336 | $27,648 | $6,815 | $20,833 |
| 2016 | $5,083 | $26,975 | $6,500 | $20,475 |
| 2015 | $2,926 | $25,449 | $8,785 | $16,664 |
| 2014 | $2,926 | $24,012 | $8,595 | $15,417 |
Source: Public Records
Map
Nearby Homes
- 1721 E 29th St
- 1747 Stuart St
- 1746 Gerritsen Ave
- 1702 E 28th St
- 2988 Nostrand Ave
- 1664 Madison Place
- 1746 E 28th St
- 2991 Quentin Rd
- 1659 Madison Place
- 1837 Burnett St
- 1817 Madison Place
- 3165 Nostrand Ave Unit 1G
- 3165 Nostrand Ave Unit 1N
- 3165 Nostrand Ave Unit 4V
- 3165 Nostrand Ave Unit 1S
- 3178 Nostrand Ave Unit 1C
- 3178 Nostrand Ave Unit 1M
- 3178 Nostrand Ave Unit 5H
- 2952 Avenue P
- 1814 E 28th St
- 1722 Stuart St
- 1716 Stuart St
- 1716 Stuart St Unit Building
- 1724 Stuart St
- 1714 Stuart St
- 1726 Stuart St
- 3061 Nostrand Ave
- 1730 Stuart St
- 3065 Nostrand Ave
- 3045-3055 Nostrand Ave
- 1732 Stuart St
- 3071 Nostrand Ave
- 1736 Stuart St
- 2938 Quentin Rd
- 1715 Stuart St
- 1719 Stuart St
- 1713 Stuart St
- 1723 Stuart St
- 1725 Stuart St
- 1705 Gerritsen Ave
Your Personal Tour Guide
Ask me questions while you tour the home.