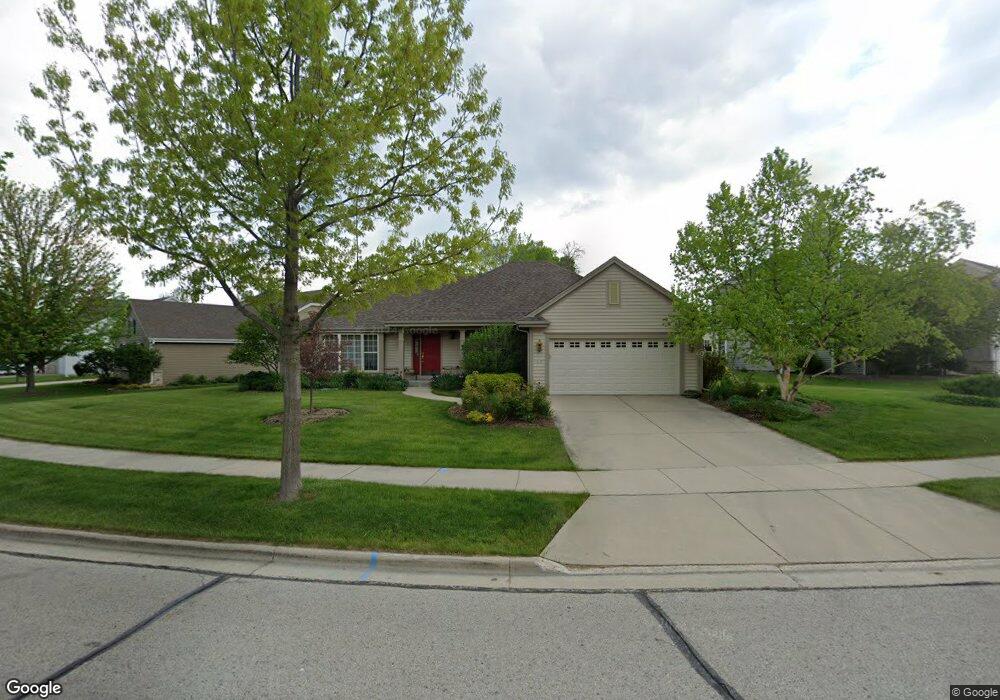
1718 Tumbleweed Cir West Bend, WI 53095
Estimated Value: $455,287 - $522,000
3
Beds
2
Baths
1,704
Sq Ft
$287/Sq Ft
Est. Value
About This Home
This home is located at 1718 Tumbleweed Cir, West Bend, WI 53095 and is currently estimated at $488,822, approximately $286 per square foot. 1718 Tumbleweed Cir is a home located in Washington County with nearby schools including Decorah Elementary School, Badger Middle School, and East High School.
Ownership History
Date
Name
Owned For
Owner Type
Purchase Details
Closed on
Aug 28, 2009
Sold by
Reisner Joyce T
Bought by
Reisner Joyce T and The Joyce T Reisner Survivors Trust
Current Estimated Value
Purchase Details
Closed on
Oct 3, 2007
Sold by
Reisner Martin and Reisner Joyce T
Bought by
The Martin Reisner & Joyce T Reisner Liv
Purchase Details
Closed on
Jul 24, 2006
Sold by
Bielinski Homes Inc
Bought by
Reisner Martin and Reisner Joyce T
Home Financials for this Owner
Home Financials are based on the most recent Mortgage that was taken out on this home.
Original Mortgage
$207,200
Interest Rate
6.82%
Mortgage Type
New Conventional
Purchase Details
Closed on
Dec 23, 2004
Sold by
Bielinski Holdings Llc
Bought by
Bielinski Homes Inc
Create a Home Valuation Report for This Property
The Home Valuation Report is an in-depth analysis detailing your home's value as well as a comparison with similar homes in the area
Home Values in the Area
Average Home Value in this Area
Purchase History
| Date | Buyer | Sale Price | Title Company |
|---|---|---|---|
| Reisner Joyce T | -- | None Available | |
| The Martin Reisner & Joyce T Reisner Liv | -- | None Available | |
| Reisner Martin | $259,100 | None Available | |
| Bielinski Homes Inc | $53,800 | None Available |
Source: Public Records
Mortgage History
| Date | Status | Borrower | Loan Amount |
|---|---|---|---|
| Previous Owner | Reisner Martin | $207,200 |
Source: Public Records
Tax History Compared to Growth
Tax History
| Year | Tax Paid | Tax Assessment Tax Assessment Total Assessment is a certain percentage of the fair market value that is determined by local assessors to be the total taxable value of land and additions on the property. | Land | Improvement |
|---|---|---|---|---|
| 2024 | $5,828 | $444,800 | $72,000 | $372,800 |
| 2023 | $5,271 | $288,700 | $55,500 | $233,200 |
| 2022 | $5,101 | $288,700 | $55,500 | $233,200 |
| 2021 | $5,241 | $288,700 | $55,500 | $233,200 |
| 2020 | $5,141 | $288,700 | $55,500 | $233,200 |
| 2019 | $4,979 | $288,700 | $55,500 | $233,200 |
| 2018 | $4,829 | $288,700 | $55,500 | $233,200 |
| 2017 | $4,148 | $223,600 | $55,500 | $168,100 |
| 2016 | $4,174 | $223,600 | $55,500 | $168,100 |
| 2015 | $4,253 | $223,600 | $55,500 | $168,100 |
| 2014 | $4,253 | $223,600 | $55,500 | $168,100 |
| 2013 | $4,596 | $223,600 | $55,500 | $168,100 |
Source: Public Records
Map
Nearby Homes
- 2490 S River Rd
- 5220 High Ridge Trail
- 2040 Paradise Hills Ct
- 1130 S River Rd
- 1275 Shadowood Cir Unit 110
- 5258 Maple Rd
- 1301 Goldcrest Ct
- 5296 County Highway P
- 1980 Paradise Dr
- Lt1 County Highway Nn
- 1125 Anchor Ave
- 1117 Anchor Ave
- 1063 Anchor Ave
- 1071 Anchor Ave
- 2600 S Main St
- 2245 E Decorah Rd
- 787 Sheridan Dr
- 1040 Lincoln Dr W
- 1317 S 7th Ave
- 2089 Decorah Rd
- 1722 Tumbleweed Cir
- 1708 Tumbleweed Cir
- 1704 Tumbleweed Cir
- 1717 Tumbleweed Cir
- 1721 Tumbleweed Cir
- 1713 Tumbleweed Cir
- 1715 Sagewood Cir
- 1725 Tumbleweed Cir
- 1721 Sagewood Cir
- 1709 Tumbleweed Cir
- 1729 Tumbleweed Cir
- 1705 Tumbleweed Cir
- 1733 Tumbleweed Cir
- 1701 Tumbleweed Cir
- 1700 Sagewood Cir
- 1801 Tumbleweed Cir
- 1736 Sagewood Cir
- 1732 Sagewood Cir
- 1704 Sagewood Cir
- 1621 Tumbleweed Cir