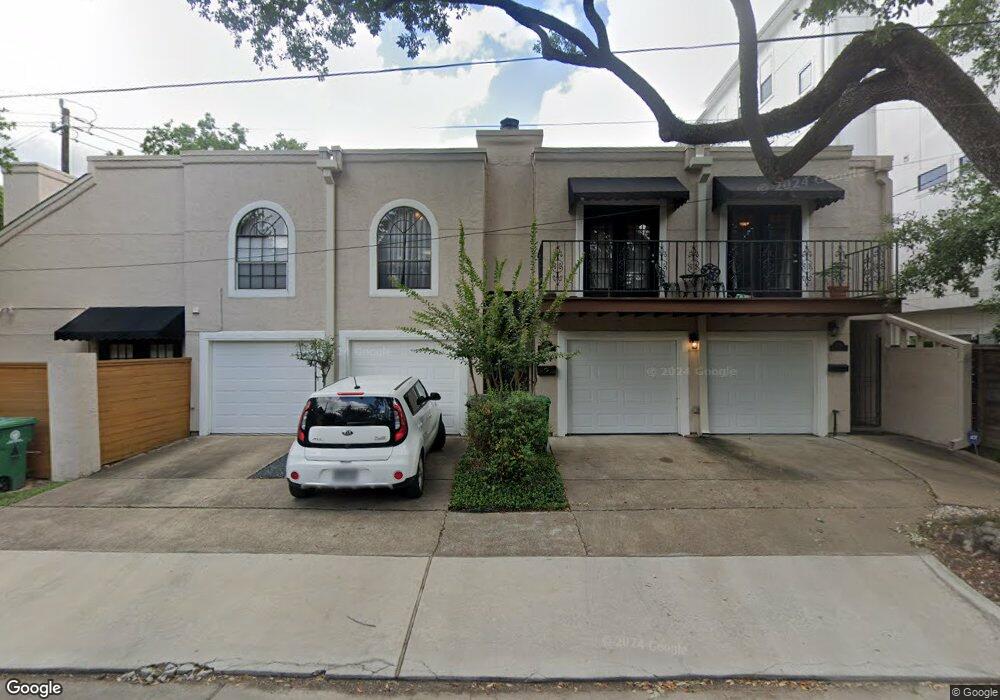
1718 Welch St Unit 1718 Houston, TX 77006
Montrose NeighborhoodEstimated Value: $268,000 - $338,000
2
Beds
2
Baths
1,124
Sq Ft
$266/Sq Ft
Est. Value
About This Home
This home is located at 1718 Welch St Unit 1718, Houston, TX 77006 and is currently estimated at $299,324, approximately $266 per square foot. 1718 Welch St Unit 1718 is a home located in Harris County with nearby schools including Baker Montessori, Lanier Middle School, and Lamar High School.
Ownership History
Date
Name
Owned For
Owner Type
Purchase Details
Closed on
May 29, 2014
Sold by
Pardue Jennifer and Perry Jennifer P
Bought by
Harrison T Pat
Current Estimated Value
Purchase Details
Closed on
Jul 7, 2001
Sold by
Harpole Jay J and Markey Benjamin D
Bought by
Tripp Nicole L
Home Financials for this Owner
Home Financials are based on the most recent Mortgage that was taken out on this home.
Original Mortgage
$96,000
Interest Rate
7.07%
Mortgage Type
Purchase Money Mortgage
Purchase Details
Closed on
Jul 20, 1999
Sold by
Bhandara Feroze and Bhandara Shernaz
Bought by
Markey Benjamin D and Harpole Jay J
Home Financials for this Owner
Home Financials are based on the most recent Mortgage that was taken out on this home.
Original Mortgage
$113,050
Interest Rate
7.47%
Mortgage Type
Purchase Money Mortgage
Create a Home Valuation Report for This Property
The Home Valuation Report is an in-depth analysis detailing your home's value as well as a comparison with similar homes in the area
Home Values in the Area
Average Home Value in this Area
Purchase History
| Date | Buyer | Sale Price | Title Company |
|---|---|---|---|
| Harrison T Pat | -- | Chicago Title | |
| Tripp Nicole L | -- | -- | |
| Markey Benjamin D | -- | Regency Title |
Source: Public Records
Mortgage History
| Date | Status | Borrower | Loan Amount |
|---|---|---|---|
| Previous Owner | Tripp Nicole L | $96,000 | |
| Previous Owner | Markey Benjamin D | $113,050 |
Source: Public Records
Tax History Compared to Growth
Tax History
| Year | Tax Paid | Tax Assessment Tax Assessment Total Assessment is a certain percentage of the fair market value that is determined by local assessors to be the total taxable value of land and additions on the property. | Land | Improvement |
|---|---|---|---|---|
| 2025 | $6,344 | $342,420 | $65,060 | $277,360 |
| 2024 | $6,344 | $303,189 | $60,231 | $242,958 |
| 2023 | $6,344 | $303,189 | $57,605 | $245,584 |
| 2022 | $6,960 | $303,189 | $57,605 | $245,584 |
| 2021 | $6,832 | $293,121 | $55,693 | $237,428 |
| 2020 | $6,659 | $275,000 | $52,250 | $222,750 |
| 2019 | $6,959 | $275,000 | $52,250 | $222,750 |
| 2018 | $6,959 | $275,000 | $52,250 | $222,750 |
| 2017 | $7,297 | $275,000 | $52,250 | $222,750 |
| 2016 | $7,915 | $298,286 | $56,674 | $241,612 |
| 2015 | $3,263 | $0 | $0 | $0 |
| 2014 | $3,263 | $166,518 | $31,639 | $134,879 |
Source: Public Records
Map
Nearby Homes
- 1718 Welch St Unit C
- 1728 Michigan St Unit A
- 1728 Michigan St Unit C
- 1705 Michigan St
- 2025 Park St
- 1808 Ridgewood St
- 1529 Welch St
- 1519 1/2 Welch St
- 1533 Nevada St
- 1506 Indiana St
- 1545 Haddon St
- 2011 Woodhead St
- 1902 Elmen St
- 1515 Vermont St Unit D
- 1511 Vermont St Unit A
- 1509 Vermont St Unit D
- Alder Plan at Commonwealth Park Townhomes
- Cypress Plan at Commonwealth Park Townhomes
- Boxwood Plan at Commonwealth Park Townhomes
- 2100 Commonwealth St Unit E
- 1718 Welch St Unit D
- 1718 Welch St Unit 1718
- 1718 Welch St Unit 1718
- 1718 Welch St Unit 1718
- 1718 Welch St Unit 1718
- 1718 Welch St Unit A
- 1718 Welch St Unit B
- 1718 Welch St Unit E
- 1710 Welch St
- 1714 Welch St
- 1716 Welch St
- 1911 Ridgewood St
- 1914 Ridgewood St Unit B
- 1914 Ridgewood St Unit C
- 1914 Ridgewood St Unit A
- 1702 Welch St
- 1914 Windsor St Unit 1
- 1914 Windsor St Unit 2
- 1910 Windsor St
- 1711 Welch St