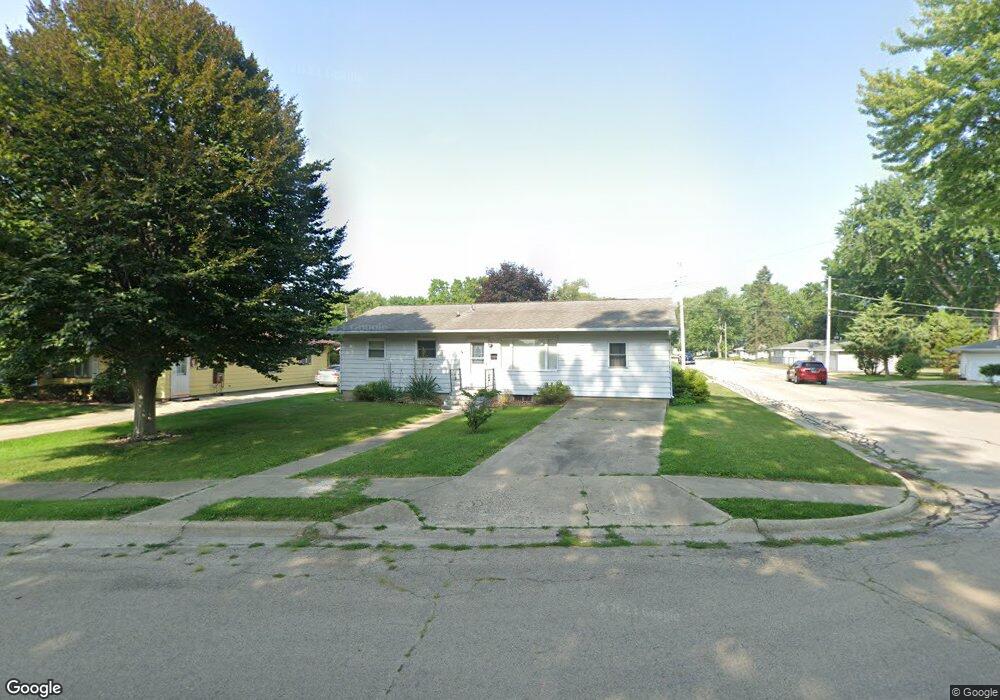
1719 19th Ave Sterling, IL 61081
Estimated Value: $127,977 - $163,000
3
Beds
1
Bath
1,175
Sq Ft
$124/Sq Ft
Est. Value
About This Home
This home is located at 1719 19th Ave, Sterling, IL 61081 and is currently estimated at $145,744, approximately $124 per square foot. 1719 19th Ave is a home located in Whiteside County with nearby schools including Christ Lutheran School.
Ownership History
Date
Name
Owned For
Owner Type
Purchase Details
Closed on
Jun 18, 2024
Sold by
Schroeder Julie A and Ranz Ted
Bought by
Ellis Haley N
Current Estimated Value
Home Financials for this Owner
Home Financials are based on the most recent Mortgage that was taken out on this home.
Original Mortgage
$116,250
Outstanding Balance
$114,688
Interest Rate
6.75%
Mortgage Type
New Conventional
Estimated Equity
$31,056
Purchase Details
Closed on
Aug 8, 2005
Sold by
Lutz Brian W and Lutz Amy M
Bought by
Schroeder Julie A
Home Financials for this Owner
Home Financials are based on the most recent Mortgage that was taken out on this home.
Original Mortgage
$74,000
Interest Rate
5.71%
Mortgage Type
Future Advance Clause Open End Mortgage
Create a Home Valuation Report for This Property
The Home Valuation Report is an in-depth analysis detailing your home's value as well as a comparison with similar homes in the area
Home Values in the Area
Average Home Value in this Area
Purchase History
| Date | Buyer | Sale Price | Title Company |
|---|---|---|---|
| Ellis Haley N | $155,000 | None Listed On Document | |
| Schroeder Julie A | $90,500 | None Available |
Source: Public Records
Mortgage History
| Date | Status | Borrower | Loan Amount |
|---|---|---|---|
| Open | Ellis Haley N | $116,250 | |
| Previous Owner | Schroeder Julie A | $74,000 |
Source: Public Records
Tax History Compared to Growth
Tax History
| Year | Tax Paid | Tax Assessment Tax Assessment Total Assessment is a certain percentage of the fair market value that is determined by local assessors to be the total taxable value of land and additions on the property. | Land | Improvement |
|---|---|---|---|---|
| 2024 | $2,884 | $33,661 | $3,302 | $30,359 |
| 2023 | $2,684 | $31,598 | $3,100 | $28,498 |
| 2022 | $2,589 | $30,232 | $2,966 | $27,266 |
| 2021 | $2,461 | $28,510 | $2,797 | $25,713 |
| 2020 | $2,369 | $27,511 | $2,699 | $24,812 |
| 2019 | $2,342 | $27,011 | $2,650 | $24,361 |
| 2018 | $2,318 | $27,054 | $2,654 | $24,400 |
| 2017 | $2,318 | $26,869 | $2,636 | $24,233 |
| 2016 | $2,238 | $26,003 | $2,551 | $23,452 |
| 2015 | $2,157 | $26,717 | $2,621 | $24,096 |
| 2014 | $2,138 | $26,124 | $2,563 | $23,561 |
| 2013 | $2,157 | $26,717 | $2,621 | $24,096 |
Source: Public Records
Map
Nearby Homes