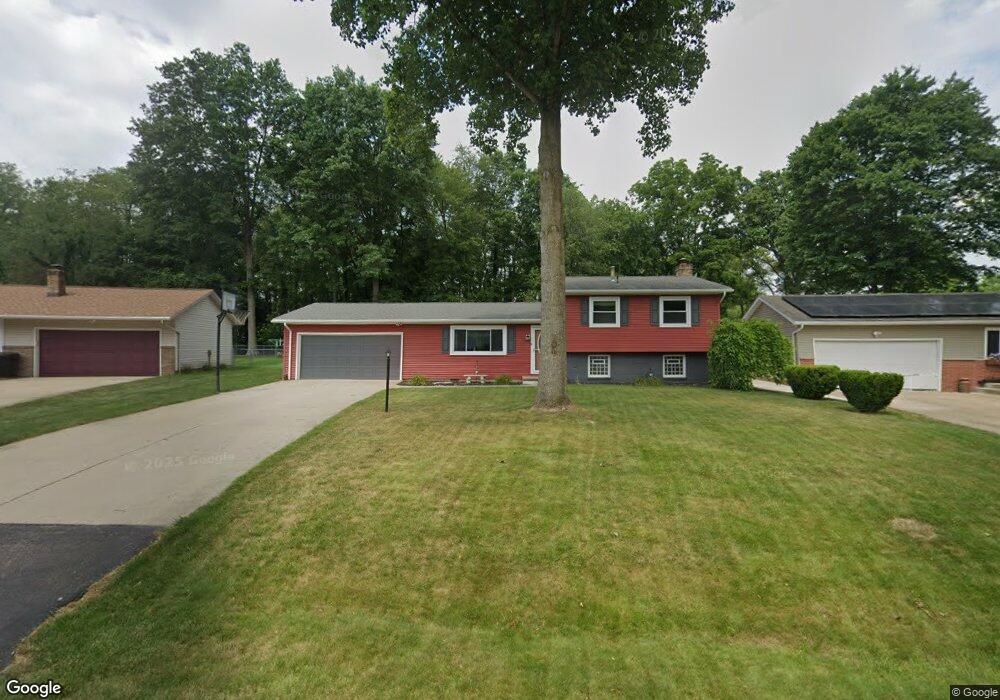
1719 Blempton Rd NW Massillon, OH 44646
Amherst Heights-Clearview NeighborhoodEstimated Value: $207,000 - $244,000
3
Beds
2
Baths
1,196
Sq Ft
$189/Sq Ft
Est. Value
About This Home
This home is located at 1719 Blempton Rd NW, Massillon, OH 44646 and is currently estimated at $225,754, approximately $188 per square foot. 1719 Blempton Rd NW is a home located in Stark County with nearby schools including Pfeiffer Intermediate School, Edison Middle School, and Perry High School.
Ownership History
Date
Name
Owned For
Owner Type
Purchase Details
Closed on
Apr 13, 2021
Sold by
Jackson James E
Bought by
Jackson Loretta L
Current Estimated Value
Purchase Details
Closed on
Aug 17, 2006
Sold by
Miday Beverly A
Bought by
Jackson James E and Jackson Loretta L
Home Financials for this Owner
Home Financials are based on the most recent Mortgage that was taken out on this home.
Original Mortgage
$130,935
Outstanding Balance
$78,910
Interest Rate
6.83%
Mortgage Type
FHA
Estimated Equity
$146,844
Purchase Details
Closed on
Mar 7, 2002
Sold by
Blocher Robert T and Blocher Theresa R
Bought by
Miday Beverly A
Home Financials for this Owner
Home Financials are based on the most recent Mortgage that was taken out on this home.
Original Mortgage
$90,000
Interest Rate
7.03%
Mortgage Type
Purchase Money Mortgage
Purchase Details
Closed on
Sep 27, 1991
Create a Home Valuation Report for This Property
The Home Valuation Report is an in-depth analysis detailing your home's value as well as a comparison with similar homes in the area
Home Values in the Area
Average Home Value in this Area
Purchase History
| Date | Buyer | Sale Price | Title Company |
|---|---|---|---|
| Jackson Loretta L | -- | American Title Assc Agcy | |
| Jackson James E | $133,000 | Patriot Title Agency Inc | |
| Miday Beverly A | $117,000 | -- | |
| -- | $20,000 | -- |
Source: Public Records
Mortgage History
| Date | Status | Borrower | Loan Amount |
|---|---|---|---|
| Open | Jackson James E | $130,935 | |
| Closed | Miday Beverly A | $90,000 |
Source: Public Records
Tax History Compared to Growth
Tax History
| Year | Tax Paid | Tax Assessment Tax Assessment Total Assessment is a certain percentage of the fair market value that is determined by local assessors to be the total taxable value of land and additions on the property. | Land | Improvement |
|---|---|---|---|---|
| 2025 | -- | $61,290 | $16,520 | $44,770 |
| 2024 | -- | $61,290 | $16,520 | $44,770 |
| 2023 | $2,671 | $53,270 | $15,190 | $38,080 |
| 2022 | $2,685 | $53,270 | $15,190 | $38,080 |
| 2021 | $2,859 | $53,270 | $15,190 | $38,080 |
| 2020 | $2,570 | $45,920 | $12,740 | $33,180 |
| 2019 | $2,318 | $45,920 | $12,740 | $33,180 |
| 2018 | $2,290 | $45,920 | $12,740 | $33,180 |
| 2017 | $2,171 | $40,330 | $10,330 | $30,000 |
| 2016 | $2,183 | $40,330 | $10,330 | $30,000 |
| 2015 | $2,202 | $40,330 | $10,330 | $30,000 |
| 2014 | $99 | $37,840 | $9,660 | $28,180 |
| 2013 | $1,000 | $37,840 | $9,660 | $28,180 |
Source: Public Records
Map
Nearby Homes
- 1836 Sedwick Ave NW
- Hudson Plan at Aberdeen Oaks - Single Family Homes
- Ballenger Plan at Aberdeen Oaks - Single Family Homes
- Aviano Plan at Aberdeen Oaks - Single Family Homes
- Allegheny Plan at Aberdeen Oaks - Single Family Homes
- Lehigh Plan at Aberdeen Oaks - Single Family Homes
- 2766 Duxbury Cir NW
- 3460 Spindle St NW
- 2942 Torrey Pines Cir NW
- 1804 Jackson Ave NW
- 3450 Crown Point St NW
- 000 Jackson Ave NW
- 3051 Blue Ash Ave NW
- 951 Mill Ridge Path NE
- 2827 Bramblebush Ave NW
- 3436 Cardiff Ave NW
- 5179 Birkdale St NW
- 5827 Hawks Nest Cir NW
- 5829 Hawks Nest Cir NW
- 5831 Hawks Nest Cir NW
- 1711 Blempton Rd NW
- 1725 Blempton Rd NW
- 1703 Blempton Rd NW
- 3475 Briardale Dr NW
- 3485 Briardale Dr NW
- 1714 Blempton Rd NW
- 1635 Blempton Rd NW
- 1730 Blempton Rd NW
- 3459 Briardale Dr NW
- 1704 Blempton Rd NW
- 3515 Briardale Dr NW
- 3451 Briardale Dr NW
- 1627 Blempton Rd NW
- 1636 Blempton Rd NW
- 3521 Briardale Dr NW
- 3470 Briardale Dr NW
- 1628 Blempton Rd NW
- 3445 Briardale Dr NW
- 3529 Briardale Dr NW
- 1621 Blempton Rd NW