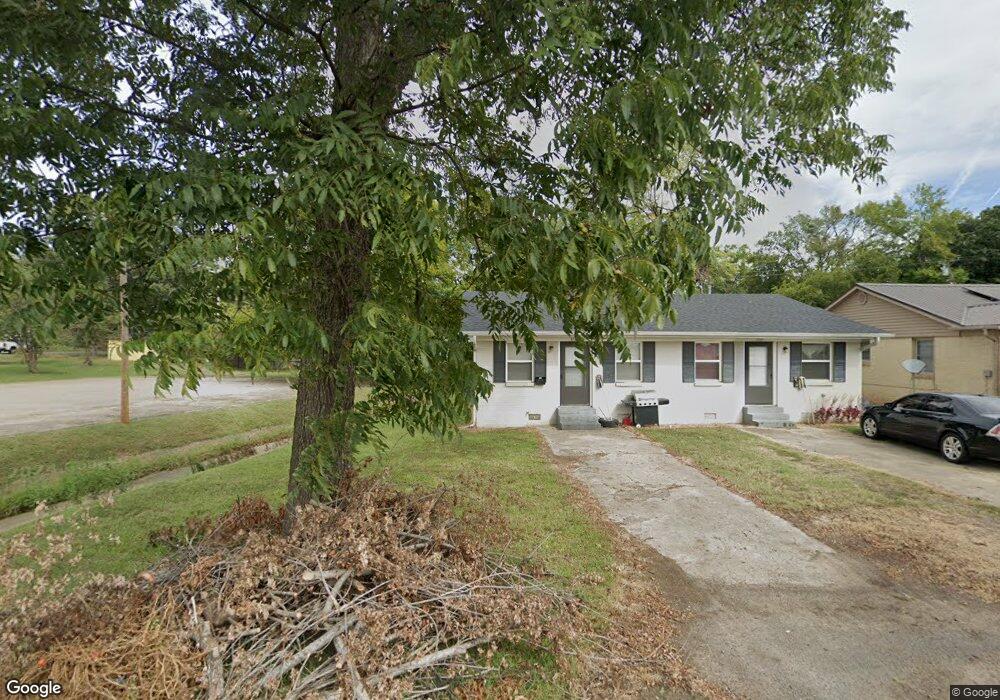
1719 Cherry St Unit 1721 van Buren, AR 72956
Estimated Value: $112,000 - $224,000
Studio
2
Baths
1,353
Sq Ft
$109/Sq Ft
Est. Value
About This Home
This home is located at 1719 Cherry St Unit 1721, van Buren, AR 72956 and is currently estimated at $147,336, approximately $108 per square foot. 1719 Cherry St Unit 1721 is a home located in Crawford County with nearby schools including King Elementary School, Butterfield Trail Middle School, and Van Buren High School.
Ownership History
Date
Name
Owned For
Owner Type
Purchase Details
Closed on
Dec 28, 2009
Sold by
Williams Jerry and Williams Donna
Bought by
Homebase Properties Llc
Current Estimated Value
Home Financials for this Owner
Home Financials are based on the most recent Mortgage that was taken out on this home.
Original Mortgage
$44,000
Interest Rate
4.9%
Mortgage Type
Future Advance Clause Open End Mortgage
Create a Home Valuation Report for This Property
The Home Valuation Report is an in-depth analysis detailing your home's value as well as a comparison with similar homes in the area
Home Values in the Area
Average Home Value in this Area
Purchase History
| Date | Buyer | Sale Price | Title Company |
|---|---|---|---|
| Homebase Properties Llc | $59,024 | -- |
Source: Public Records
Mortgage History
| Date | Status | Borrower | Loan Amount |
|---|---|---|---|
| Closed | Homebase Properties Llc | $44,000 |
Source: Public Records
Tax History
| Year | Tax Paid | Tax Assessment Tax Assessment Total Assessment is a certain percentage of the fair market value that is determined by local assessors to be the total taxable value of land and additions on the property. | Land | Improvement |
|---|---|---|---|---|
| 2025 | $731 | $14,080 | $2,000 | $12,080 |
| 2024 | $675 | $14,080 | $2,000 | $12,080 |
| 2023 | $619 | $14,080 | $2,000 | $12,080 |
| 2022 | $563 | $10,840 | $1,500 | $9,340 |
| 2021 | $563 | $10,840 | $1,500 | $9,340 |
| 2020 | $563 | $10,840 | $1,500 | $9,340 |
| 2019 | $538 | $10,840 | $1,500 | $9,340 |
| 2018 | $493 | $10,840 | $1,500 | $9,340 |
| 2017 | $448 | $8,640 | $1,500 | $7,140 |
| 2016 | $448 | $8,640 | $1,500 | $7,140 |
| 2015 | $423 | $8,640 | $1,500 | $7,140 |
| 2014 | $423 | $8,640 | $1,500 | $7,140 |
Source: Public Records
Map
Nearby Homes
Your Personal Tour Guide
Ask me questions while you tour the home.