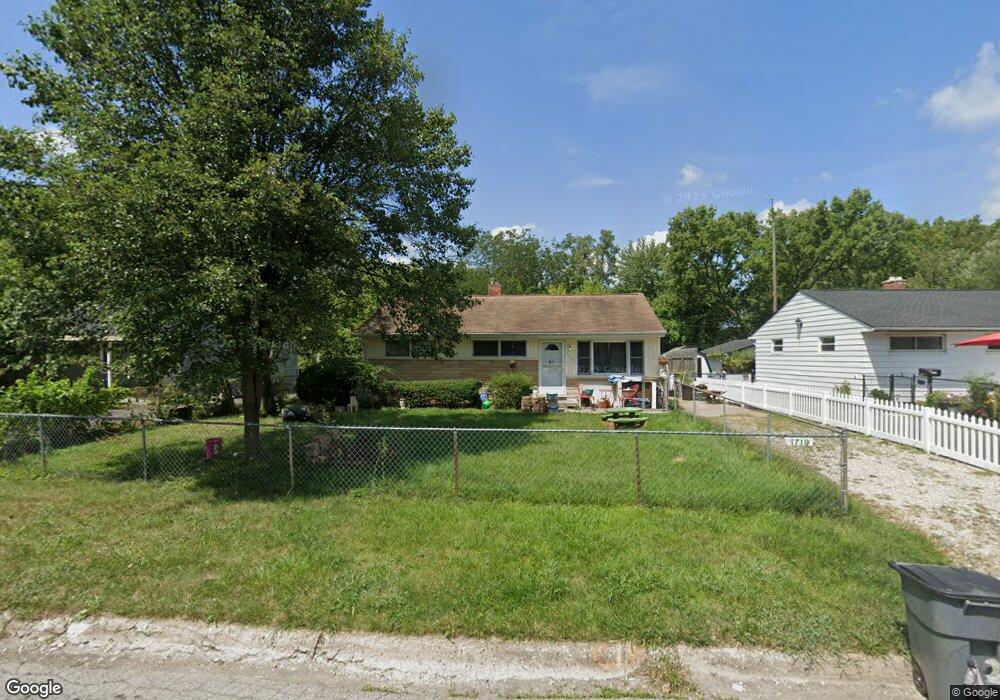
1719 Eastbrook Dr N Columbus, OH 43223
Estimated Value: $164,653 - $185,000
3
Beds
1
Bath
925
Sq Ft
$186/Sq Ft
Est. Value
About This Home
This home is located at 1719 Eastbrook Dr N, Columbus, OH 43223 and is currently estimated at $172,163, approximately $186 per square foot. 1719 Eastbrook Dr N is a home with nearby schools including Finland Elementary School, Franklin Woods Intermediate School, and Finland Middle School.
Ownership History
Date
Name
Owned For
Owner Type
Purchase Details
Closed on
Jun 22, 2018
Sold by
Gifford William M and Gifford Kim
Bought by
James Steven and Datz Sarah A
Current Estimated Value
Home Financials for this Owner
Home Financials are based on the most recent Mortgage that was taken out on this home.
Original Mortgage
$83,323
Outstanding Balance
$72,060
Interest Rate
4.5%
Mortgage Type
New Conventional
Estimated Equity
$100,103
Purchase Details
Closed on
May 9, 2015
Sold by
Gifford Warren C and Gifford Elaine
Bought by
Gifford William M and Gifford Kim
Home Financials for this Owner
Home Financials are based on the most recent Mortgage that was taken out on this home.
Original Mortgage
$42,750
Interest Rate
3.68%
Mortgage Type
New Conventional
Purchase Details
Closed on
Aug 29, 2006
Sold by
Gifford Warren C and Gifford Viola P
Bought by
Gifford Warren C and Gifford William M
Purchase Details
Closed on
Jul 5, 1963
Bought by
Gifford Warren C
Create a Home Valuation Report for This Property
The Home Valuation Report is an in-depth analysis detailing your home's value as well as a comparison with similar homes in the area
Home Values in the Area
Average Home Value in this Area
Purchase History
| Date | Buyer | Sale Price | Title Company |
|---|---|---|---|
| James Steven | $85,900 | Patriot Title | |
| Gifford William M | -- | Nationallink | |
| Gifford Warren C | $20,000 | Title First | |
| Gifford Warren C | -- | -- |
Source: Public Records
Mortgage History
| Date | Status | Borrower | Loan Amount |
|---|---|---|---|
| Open | James Steven | $83,323 | |
| Closed | Gifford William M | $42,750 |
Source: Public Records
Tax History Compared to Growth
Tax History
| Year | Tax Paid | Tax Assessment Tax Assessment Total Assessment is a certain percentage of the fair market value that is determined by local assessors to be the total taxable value of land and additions on the property. | Land | Improvement |
|---|---|---|---|---|
| 2024 | $2,514 | $49,290 | $8,580 | $40,710 |
| 2023 | $2,500 | $49,280 | $8,575 | $40,705 |
| 2022 | $1,511 | $20,480 | $10,290 | $10,190 |
| 2021 | $1,436 | $20,480 | $10,290 | $10,190 |
| 2020 | $1,433 | $20,480 | $10,290 | $10,190 |
| 2019 | $1,284 | $16,460 | $8,580 | $7,880 |
| 2018 | $1,281 | $16,460 | $8,580 | $7,880 |
| 2017 | $1,272 | $16,460 | $8,580 | $7,880 |
| 2016 | $1,382 | $16,770 | $3,470 | $13,300 |
| 2015 | $1,283 | $16,770 | $3,470 | $13,300 |
| 2014 | $1,321 | $16,770 | $3,470 | $13,300 |
| 2013 | $762 | $19,705 | $4,060 | $15,645 |
Source: Public Records
Map
Nearby Homes
- 1607 Red Leaf Ln
- 1543 Red Leaf Ln
- 1417 Fahy Dr
- 2210 October Ridge Dr
- 1390 Gray Meadow Dr
- 1948 Big Run Bluffs Blvd
- 1723 Farberdale Dr
- 1949 Big Run Bluffs Blvd
- 0 S Central Ave
- 4745 Big Run Rd E
- 1994 Little Ave
- 1532 Westmeadow Dr
- 2180 Eakin Rd
- 2336 Woodbrook Cir N Unit 92 B
- 1122 Harrisburg Pike
- 1663 Hopkins Ave
- 2436 Onyx Ct
- 2362 Woodbrook Cir N Unit 81
- 1119 Hardesty Place E Unit 1
- 1540 Little Ave
- 1729 Eastbrook Dr S
- 1709 Eastbrook Dr N
- 1737 Eastbrook Dr S
- 1776 Eastfield Dr N
- 1777 Eastfield Dr N
- 1697 Eastbrook Dr N
- 1691 Eastbrook Dr
- 1700 Eastbrook Dr N
- 1700 Eastbrook Dr N Unit Seneca Woods
- 1743 Eastbrook Dr S
- 1768 Eastfield Dr N
- 1773 Eastfield Dr N
- 1790 Marsdale Ave
- 1692 Eastbrook Dr N
- 1685 Eastbrook Dr N
- 1749 Eastbrook Dr S
- 1782 Marsdale Ave
- 1765 Eastfield Dr N
- 1681 Eastbrook Dr N
- 1684 Eastbrook Dr N