
Seller's Agent in 2022
Lisa Belinky Crawford
Sibcy Cline
(513) 708-1600
6 in this area
112 Total Sales

Estimated Value: $173,000 - $222,000
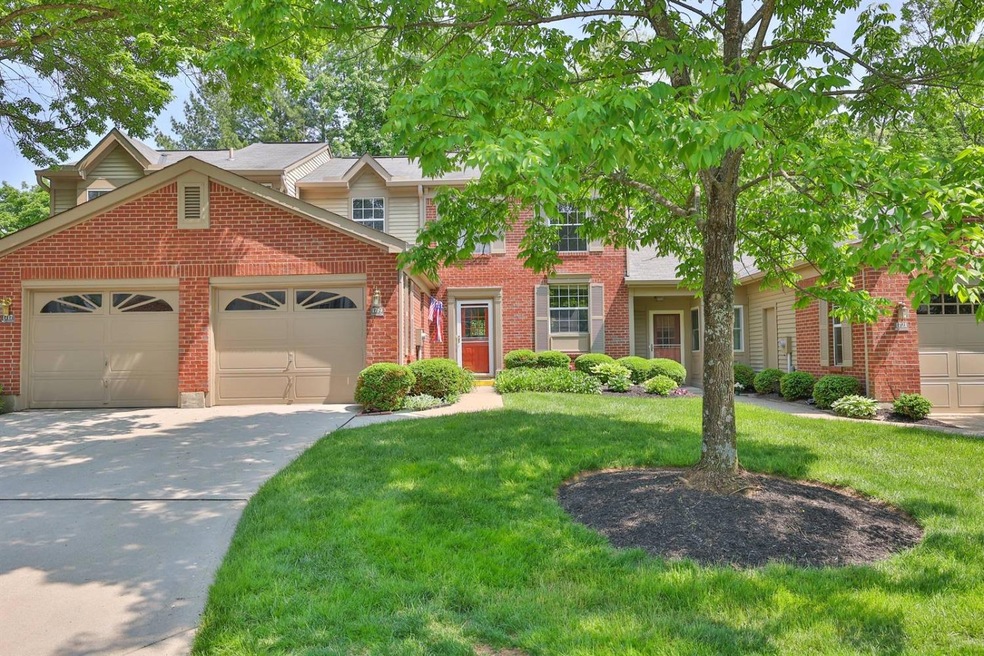
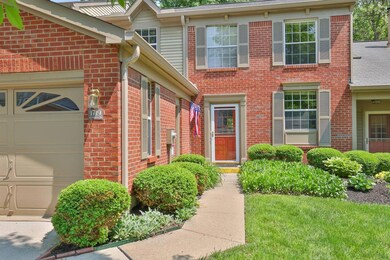
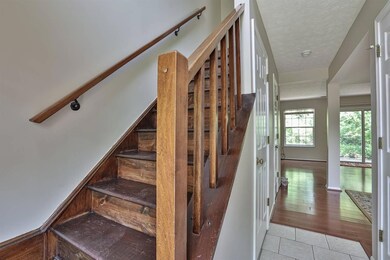
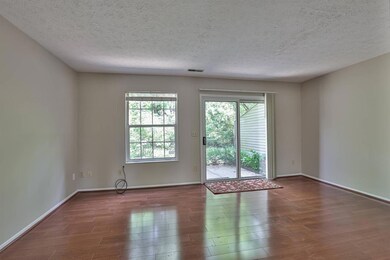
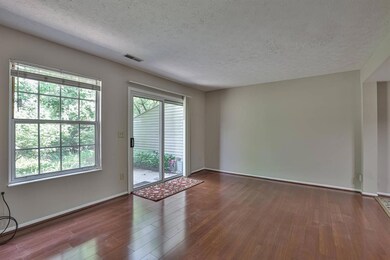
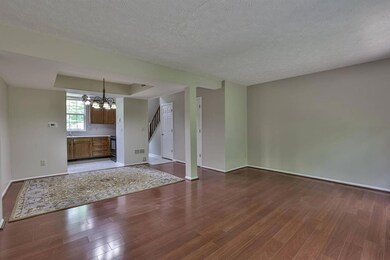
Pristine condo in desirable Anderson Greens! The light-filled living rm w/vaulted ceilings, walks out to a private patio & charming garden. Primary BR has dual closets, vaulted ceilings, & an en-suite w/granite counters & a large soaking tub. Garage has lofted storage. Freshly painted & move-in ready! Pool community. Seller to review offers 5/16 @ 11AM. Seller reserves the right to accept any offer at any time.
Last Agent to Sell the Property
Sibcy Cline, Inc. License #2013001930 Listed on: 05/13/2022
| Date | Buyer | Sale Price | Title Company |
|---|---|---|---|
| Popovych Pavlo | $186,000 | Elam Jenni B |
| Date | Status | Borrower | Loan Amount |
|---|---|---|---|
| Open | Popovych Pavlo | $141,600 |
| Date | Event | Price | List to Sale | Price per Sq Ft |
|---|---|---|---|---|
| 06/13/2022 06/13/22 | Sold | $186,000 | +6.3% | $179 / Sq Ft |
| 05/14/2022 05/14/22 | Pending | -- | -- | -- |
| 05/13/2022 05/13/22 | For Sale | $175,000 | -- | $169 / Sq Ft |
| Year | Tax Paid | Tax Assessment Tax Assessment Total Assessment is a certain percentage of the fair market value that is determined by local assessors to be the total taxable value of land and additions on the property. | Land | Improvement |
|---|---|---|---|---|
| 2025 | $4,069 | $65,100 | $9,975 | $55,125 |
| 2024 | $3,954 | $65,100 | $9,975 | $55,125 |
| 2023 | $3,761 | $65,100 | $9,975 | $55,125 |
| 2022 | $2,111 | $41,346 | $8,330 | $33,016 |
| 2021 | $2,051 | $41,346 | $8,330 | $33,016 |
| 2020 | $2,088 | $41,346 | $8,330 | $33,016 |
| 2019 | $1,830 | $34,745 | $7,000 | $27,745 |
| 2018 | $1,715 | $34,745 | $7,000 | $27,745 |
| 2017 | $1,611 | $34,745 | $7,000 | $27,745 |
| 2016 | $1,637 | $34,650 | $7,238 | $27,412 |
| 2015 | $1,596 | $34,650 | $7,238 | $27,412 |
| 2014 | $1,598 | $34,650 | $7,238 | $27,412 |
| 2013 | $1,787 | $39,375 | $8,225 | $31,150 |
Seller's Agent in 2022
Lisa Belinky Crawford
Sibcy Cline
(513) 708-1600
6 in this area
112 Total Sales
Buyer's Agent in 2022
Maria Osokina
Coldwell Banker Realty
(513) 760-2404
1 in this area
88 Total Sales
Source: MLS of Greater Cincinnati (CincyMLS)
MLS Number: 1738887
APN: 500-0214-0235
Disclaimer: Certain information contained herein is derived from information provided by parties other than Homes.com. All information provided is deemed reliable, but is not guaranteed to be accurate and should be independently verified.
![]() The data relating to real estate for sale on this website comes in part from the Broker Reciprocity programs of the MLS of Greater Cincinnati, Inc.. Those listings held by brokerage firms other than Ten-X are marked with the Broker Reciprocity logo and house icon. The properties displayed may not be all of the properties available through Broker Reciprocity.
The data relating to real estate for sale on this website comes in part from the Broker Reciprocity programs of the MLS of Greater Cincinnati, Inc.. Those listings held by brokerage firms other than Ten-X are marked with the Broker Reciprocity logo and house icon. The properties displayed may not be all of the properties available through Broker Reciprocity.
IDX information is provided exclusively for personal, non-commercial use, and may not be used for any purpose other than to identify prospective properties consumers may be interested in purchasing.
Information is deemed reliable but not guaranteed.
Ten-X does not display the entire Cincinnati MLS Broker Reciprocity™ database on this web site. The listings of some real estate brokerage firms have been excluded.
Copyright 2026, MLS of Greater Cincinnati, Inc. All rights reserved
Ask me questions while you tour the home.