1719 Jeremy Dr Monroe, GA 30656
Estimated Value: $328,000 - $365,000
4
Beds
3
Baths
1,958
Sq Ft
$177/Sq Ft
Est. Value
About This Home
This home is located at 1719 Jeremy Dr, Monroe, GA 30656 and is currently estimated at $345,714, approximately $176 per square foot. 1719 Jeremy Dr is a home located in Barrow County with nearby schools including Bethlehem Elementary School, Haymon-Morris Middle School, and Apalachee High School.
Ownership History
Date
Name
Owned For
Owner Type
Purchase Details
Closed on
Jul 30, 2021
Sold by
Herrington Russell P
Bought by
Robinson Kenneth Lanier and Robinson Sharon Mccravy
Current Estimated Value
Home Financials for this Owner
Home Financials are based on the most recent Mortgage that was taken out on this home.
Original Mortgage
$219,598
Outstanding Balance
$164,862
Interest Rate
2.9%
Mortgage Type
New Conventional
Estimated Equity
$180,852
Purchase Details
Closed on
Sep 29, 2006
Sold by
Herrington Russell
Bought by
Herrington Russell P and Herrington Kelli M
Home Financials for this Owner
Home Financials are based on the most recent Mortgage that was taken out on this home.
Original Mortgage
$154,933
Interest Rate
6.25%
Mortgage Type
FHA
Purchase Details
Closed on
May 22, 2006
Sold by
Riverbend Of Barrow Llc
Bought by
Paradigm Construction Co
Purchase Details
Closed on
Mar 28, 2005
Bought by
Riverbend Of Barrow Llc
Create a Home Valuation Report for This Property
The Home Valuation Report is an in-depth analysis detailing your home's value as well as a comparison with similar homes in the area
Home Values in the Area
Average Home Value in this Area
Purchase History
| Date | Buyer | Sale Price | Title Company |
|---|---|---|---|
| Robinson Kenneth Lanier | $255,000 | -- | |
| Herrington Russell P | -- | -- | |
| Herrington Russell | $157,400 | -- | |
| Paradigm Construction Co | $39,000 | -- | |
| Riverbend Of Barrow Llc | -- | -- |
Source: Public Records
Mortgage History
| Date | Status | Borrower | Loan Amount |
|---|---|---|---|
| Open | Robinson Kenneth Lanier | $219,598 | |
| Previous Owner | Herrington Russell | $154,933 |
Source: Public Records
Tax History Compared to Growth
Tax History
| Year | Tax Paid | Tax Assessment Tax Assessment Total Assessment is a certain percentage of the fair market value that is determined by local assessors to be the total taxable value of land and additions on the property. | Land | Improvement |
|---|---|---|---|---|
| 2024 | $3,008 | $119,654 | $24,000 | $95,654 |
| 2023 | $2,999 | $120,054 | $24,000 | $96,054 |
| 2022 | $2,679 | $91,719 | $16,000 | $75,719 |
| 2021 | $1,866 | $63,647 | $16,000 | $47,647 |
| 2020 | $1,866 | $63,647 | $16,000 | $47,647 |
| 2019 | $1,897 | $63,647 | $16,000 | $47,647 |
| 2018 | $1,765 | $59,647 | $12,000 | $47,647 |
| 2017 | $1,412 | $48,509 | $12,000 | $36,509 |
| 2016 | $1,357 | $47,080 | $12,000 | $35,080 |
| 2015 | $1,375 | $47,457 | $12,000 | $35,457 |
| 2014 | -- | $43,478 | $7,644 | $35,834 |
| 2013 | -- | $41,184 | $7,644 | $33,540 |
Source: Public Records
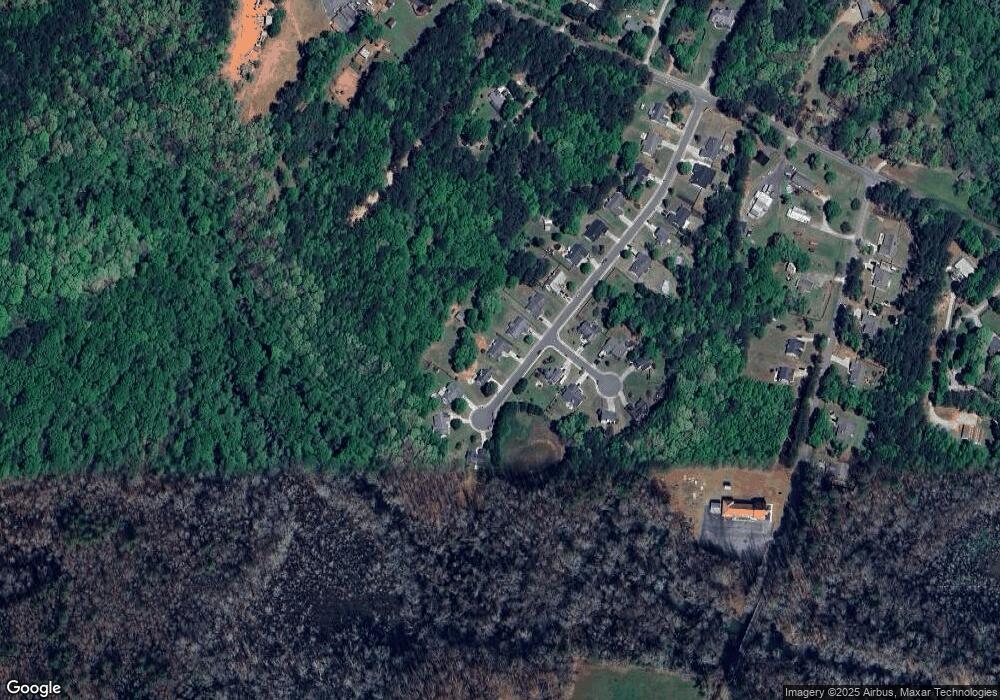
Map
Nearby Homes
- 3629 Perry Smith Rd NW
- 0 Manning Gin Rd Unit 10529477
- 0 Manning Gin Rd Unit 7585578
- 3300 Jack Glass Rd
- 1625 Austin Rd
- 296 Westminster Trail
- 131 Wallace Dr
- 111 Mockingbird Ln Unit 15
- 142 Brockton Way Unit 9
- 159 Mockingbird Ln Unit 16
- 199 Mockingbird Ln Unit 17
- 225 Mockingbird Ln Unit 18
- 247 Mockingbird Ln Unit 19
- 271 Mockingbird Ln Unit 20
- 101 Westminster Ct
- 291 Mockingbird Ln Unit 21
- 1210 Austin Rd
- 140 Westminster Ct
- 1717 Jeremy Dr
- 0 Good Hope Trail
- 1715 Jeremy Dr
- 815 Good Hope Trail
- 1723 Jeremy Dr
- 810 Good Hope Trail
- 825 Good Hope Trail
- 1713 Jeremy Dr
- 1725 Jeremy Dr
- 1722 Jeremy Dr
- 820 Good Hope Trail
- 1711 Jeremy Dr
- 1711 Jeremy Dr Unit 1
- 835 Good Hope Trail
- 0 Jeremy Dr Unit 8073815
- 0 Jeremy Dr Unit 8997736
- 0 Jeremy Dr
- 830 Good Hope Trail
- 1710 Jeremy Dr
- 1709 Jeremy Dr