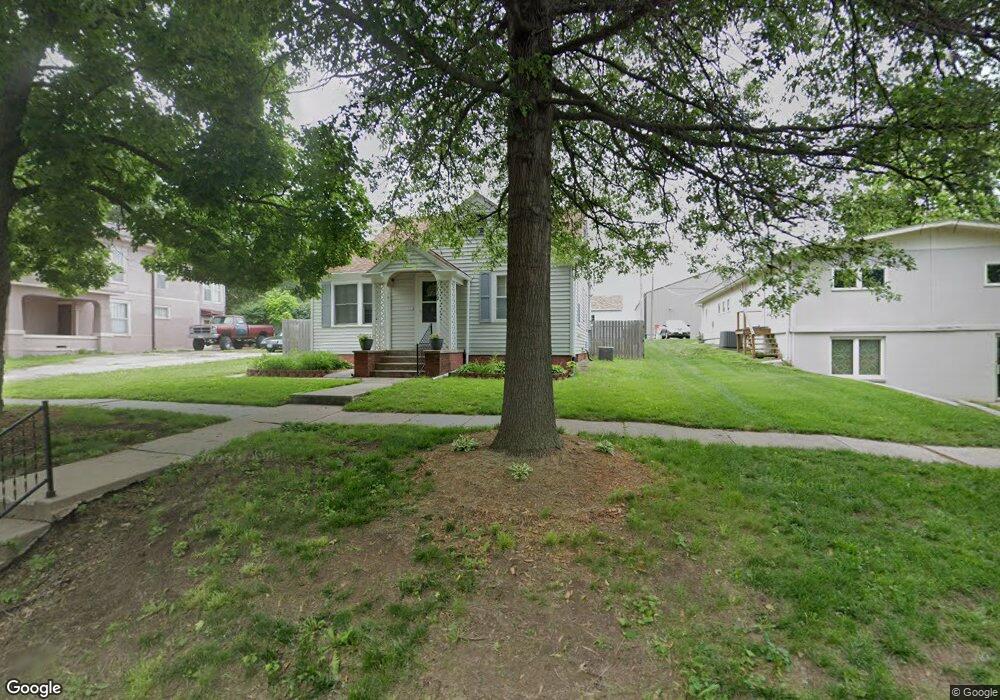
1719 Lane St Falls City, NE 68355
Estimated Value: $80,382 - $111,000
1
Bed
1
Bath
852
Sq Ft
$112/Sq Ft
Est. Value
About This Home
This home is located at 1719 Lane St, Falls City, NE 68355 and is currently estimated at $95,596, approximately $112 per square foot. 1719 Lane St is a home located in Richardson County with nearby schools including Falls City North Elementary School, Falls City South Elementary School, and Falls City Middle School.
Ownership History
Date
Name
Owned For
Owner Type
Purchase Details
Closed on
May 28, 2021
Sold by
Ankrom Kenneth
Bought by
Schawang Elizabeth J
Current Estimated Value
Purchase Details
Closed on
Mar 1, 2017
Sold by
Jensen Kirk L
Bought by
King Joint Richard D and King Jane M
Purchase Details
Closed on
May 2, 2011
Sold by
Ankrom Kenneth W and Ankrom Gail A
Bought by
Ankrom Kenne W and Ankrom Gail A
Purchase Details
Closed on
Jan 17, 2003
Sold by
Woollen Corinna L
Bought by
Ankrom Kenneth
Purchase Details
Closed on
Jun 29, 2001
Sold by
Woollen Todd A and Woollen Corrina L
Bought by
Woollen Corinna L
Purchase Details
Closed on
Jun 13, 2001
Sold by
Kennedy Karrie Louise
Bought by
Woollen Todd A and Woollen Corrina L
Create a Home Valuation Report for This Property
The Home Valuation Report is an in-depth analysis detailing your home's value as well as a comparison with similar homes in the area
Home Values in the Area
Average Home Value in this Area
Purchase History
| Date | Buyer | Sale Price | Title Company |
|---|---|---|---|
| Schawang Elizabeth J | $70,000 | -- | |
| King Joint Richard D | $60,000 | -- | |
| Ankrom Kenne W | -- | -- | |
| Ankrom Kenneth | $45,000 | -- | |
| Woollen Corinna L | -- | -- | |
| Woollen Todd A | $40,000 | -- |
Source: Public Records
Tax History Compared to Growth
Tax History
| Year | Tax Paid | Tax Assessment Tax Assessment Total Assessment is a certain percentage of the fair market value that is determined by local assessors to be the total taxable value of land and additions on the property. | Land | Improvement |
|---|---|---|---|---|
| 2025 | $575 | $51,993 | $3,816 | $48,177 |
| 2024 | $575 | $49,266 | $3,816 | $45,450 |
| 2023 | $904 | $55,132 | $3,816 | $51,316 |
| 2022 | $986 | $51,329 | $1,814 | $49,515 |
| 2021 | $971 | $51,827 | $1,814 | $50,013 |
| 2020 | $936 | $49,445 | $1,814 | $47,631 |
| 2019 | $925 | $48,058 | $1,814 | $46,244 |
| 2018 | $907 | $46,711 | $1,814 | $44,897 |
| 2017 | $909 | $46,711 | $1,814 | $44,897 |
| 2016 | $771 | $39,787 | $1,814 | $37,973 |
| 2015 | $773 | $39,787 | $1,814 | $37,973 |
| 2014 | $772 | $39,787 | $1,814 | $37,973 |
Source: Public Records
Map
Nearby Homes