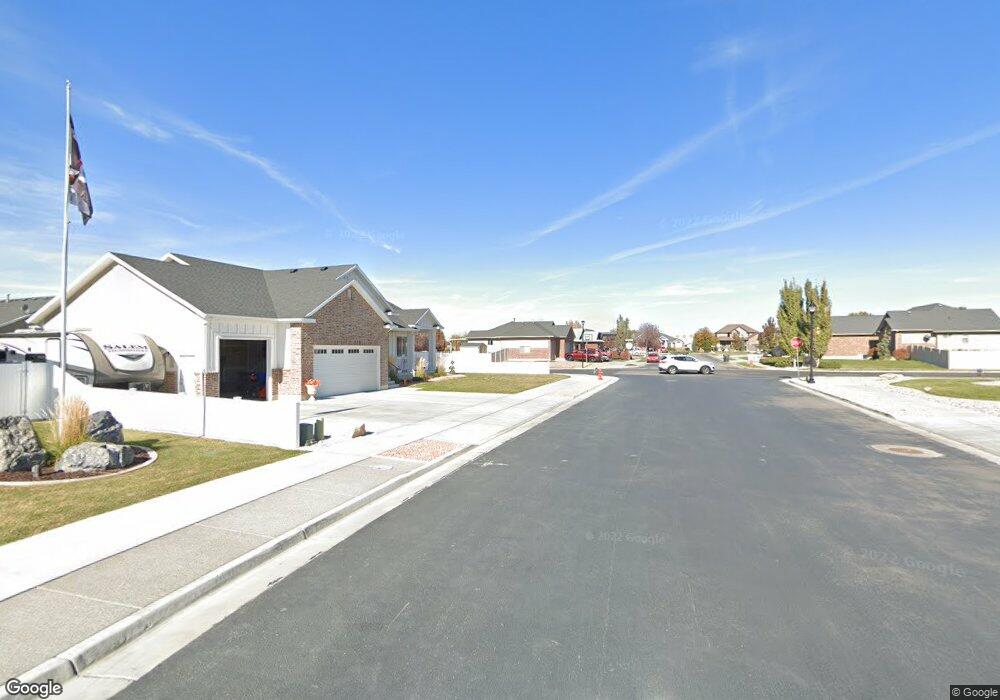
1719 N 2900 W Clearfield, UT 84015
Estimated Value: $380,000 - $412,540
4
Beds
2
Baths
1,764
Sq Ft
$228/Sq Ft
Est. Value
About This Home
This home is located at 1719 N 2900 W, Clearfield, UT 84015 and is currently estimated at $401,635, approximately $227 per square foot. 1719 N 2900 W is a home located in Davis County with nearby schools including West Clinton Elementary School, West Point Junior High School, and Syracuse High School.
Ownership History
Date
Name
Owned For
Owner Type
Purchase Details
Closed on
Sep 28, 2011
Sold by
Federal National Mortgage Association
Bought by
Snover Cassidy
Current Estimated Value
Purchase Details
Closed on
Jul 6, 2011
Sold by
Miller David and Miller Jessie
Bought by
Federal National Mortgage Association
Purchase Details
Closed on
Feb 25, 2009
Sold by
Walker Marc R and Walker Lonnita D
Bought by
Miller David and Miller Jessie
Home Financials for this Owner
Home Financials are based on the most recent Mortgage that was taken out on this home.
Original Mortgage
$123,500
Interest Rate
4.91%
Mortgage Type
Purchase Money Mortgage
Create a Home Valuation Report for This Property
The Home Valuation Report is an in-depth analysis detailing your home's value as well as a comparison with similar homes in the area
Home Values in the Area
Average Home Value in this Area
Purchase History
| Date | Buyer | Sale Price | Title Company |
|---|---|---|---|
| Snover Cassidy | $120,000 | Us Title Company Of | |
| Federal National Mortgage Association | -- | Lincoln Title Insura | |
| Miller David | -- | First American Title |
Source: Public Records
Mortgage History
| Date | Status | Borrower | Loan Amount |
|---|---|---|---|
| Previous Owner | Miller David | $123,500 |
Source: Public Records
Tax History Compared to Growth
Tax History
| Year | Tax Paid | Tax Assessment Tax Assessment Total Assessment is a certain percentage of the fair market value that is determined by local assessors to be the total taxable value of land and additions on the property. | Land | Improvement |
|---|---|---|---|---|
| 2025 | $1,951 | $187,550 | $86,993 | $100,557 |
| 2024 | $1,906 | $184,250 | $95,964 | $88,286 |
| 2023 | $1,744 | $312,000 | $108,586 | $203,414 |
| 2022 | $1,851 | $183,150 | $67,156 | $115,994 |
| 2021 | $1,717 | $252,000 | $82,833 | $169,167 |
| 2020 | $1,487 | $216,000 | $69,736 | $146,264 |
| 2019 | $1,445 | $205,000 | $82,697 | $122,303 |
| 2018 | $1,291 | $180,000 | $70,008 | $109,992 |
| 2016 | $1,120 | $80,630 | $27,124 | $53,506 |
| 2015 | $1,084 | $74,195 | $27,124 | $47,071 |
| 2014 | $1,025 | $71,268 | $27,124 | $44,144 |
| 2013 | -- | $71,604 | $25,230 | $46,374 |
Source: Public Records
Map
Nearby Homes
- 3941 W 1800 N
- 1958 N 2750 W
- 2642 W 1500 N
- 2921 W 1300 N
- 1509 N 2475 W
- 3168 W 1300 N
- 2413 N Eurasian Crane Rd
- 1449 N 2475 W
- 1458 N 2400 W
- 1251 N 2525 W
- Harvard Plan at Summerfield - Enclave
- 2208 W 2615 N
- Linden Plan at Summerfield - Vista
- Yale Plan at Summerfield - Enclave
- Gambel Oak Plan at Summerfield - Vista
- Cedar Plan at Summerfield - Vista
- Elm Plan at Summerfield - Vista
- Princeton Plan at Summerfield - Enclave
- Cambridge Plan at Summerfield - Enclave
- Cornell Plan at Summerfield - Enclave