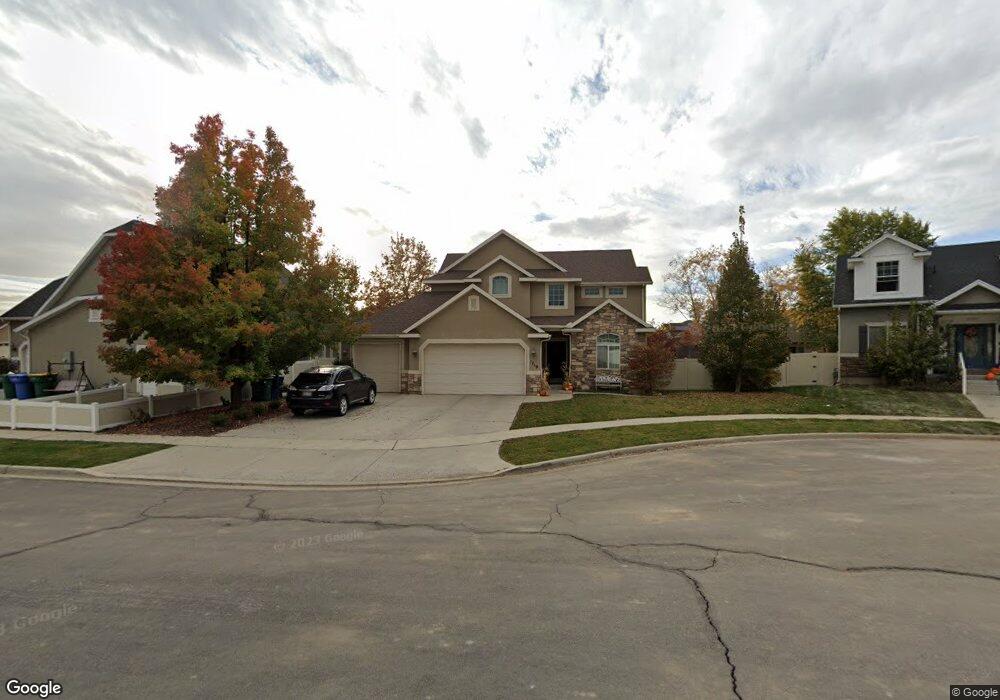
1719 N 820 W Orem, UT 84057
Aspen NeighborhoodEstimated Value: $648,000 - $798,000
5
Beds
4
Baths
2,880
Sq Ft
$248/Sq Ft
Est. Value
About This Home
This home is located at 1719 N 820 W, Orem, UT 84057 and is currently estimated at $715,671, approximately $248 per square foot. 1719 N 820 W is a home located in Utah County with nearby schools including Aspen Elementary School, Oak Canyon Junior High School, and Timpanogos High School.
Ownership History
Date
Name
Owned For
Owner Type
Purchase Details
Closed on
Nov 25, 2013
Sold by
Champion Brian and Champion Elaine F
Bought by
Mckell Heather
Current Estimated Value
Purchase Details
Closed on
Jan 14, 2005
Sold by
Utah West Development Inc
Bought by
Cockrell Christopher A and The Custom Home Co
Home Financials for this Owner
Home Financials are based on the most recent Mortgage that was taken out on this home.
Original Mortgage
$236,250
Interest Rate
5.74%
Mortgage Type
Construction
Create a Home Valuation Report for This Property
The Home Valuation Report is an in-depth analysis detailing your home's value as well as a comparison with similar homes in the area
Home Values in the Area
Average Home Value in this Area
Purchase History
| Date | Buyer | Sale Price | Title Company |
|---|---|---|---|
| Mckell Heather | -- | Access Title Co | |
| Cockrell Christopher A | -- | Metro National Title Orem |
Source: Public Records
Mortgage History
| Date | Status | Borrower | Loan Amount |
|---|---|---|---|
| Previous Owner | Cockrell Christopher A | $236,250 |
Source: Public Records
Tax History Compared to Growth
Tax History
| Year | Tax Paid | Tax Assessment Tax Assessment Total Assessment is a certain percentage of the fair market value that is determined by local assessors to be the total taxable value of land and additions on the property. | Land | Improvement |
|---|---|---|---|---|
| 2025 | $2,619 | $331,430 | $248,400 | $354,200 |
| 2024 | $2,619 | $320,210 | $0 | $0 |
| 2023 | $2,481 | $326,095 | $0 | $0 |
| 2022 | $2,695 | $343,090 | $0 | $0 |
| 2021 | $2,439 | $470,400 | $180,200 | $290,200 |
| 2020 | $2,285 | $433,100 | $156,700 | $276,400 |
| 2019 | $2,179 | $429,500 | $156,700 | $272,800 |
| 2018 | $2,120 | $399,200 | $156,700 | $242,500 |
| 2017 | $2,177 | $219,560 | $0 | $0 |
| 2016 | $2,257 | $209,990 | $0 | $0 |
| 2015 | $2,253 | $198,165 | $0 | $0 |
| 2014 | $2,038 | $178,475 | $0 | $0 |
Source: Public Records
Map
Nearby Homes
- 1798 N 860 W
- 856 W 1840 N
- 736 W 1800 N
- 1561 N 740 W
- 1643 N 645 W
- 613 W 1550 N
- 1991 N 920 W
- 1405 N 770 W
- 1554 N 1150 W
- 597 W 1400 N
- 1499 N 1200 W Unit 8
- 1154 W 1340 N
- 582 W 1300 N
- 1503 N 1285 W
- 1455 N Amiron Way Unit A
- 1336 N 1230 W
- 545 W 1240 N
- 1527 N 275 St W Unit 4
- 1543 N 275 St W Unit 2
- 1531 N 275 St W Unit 3