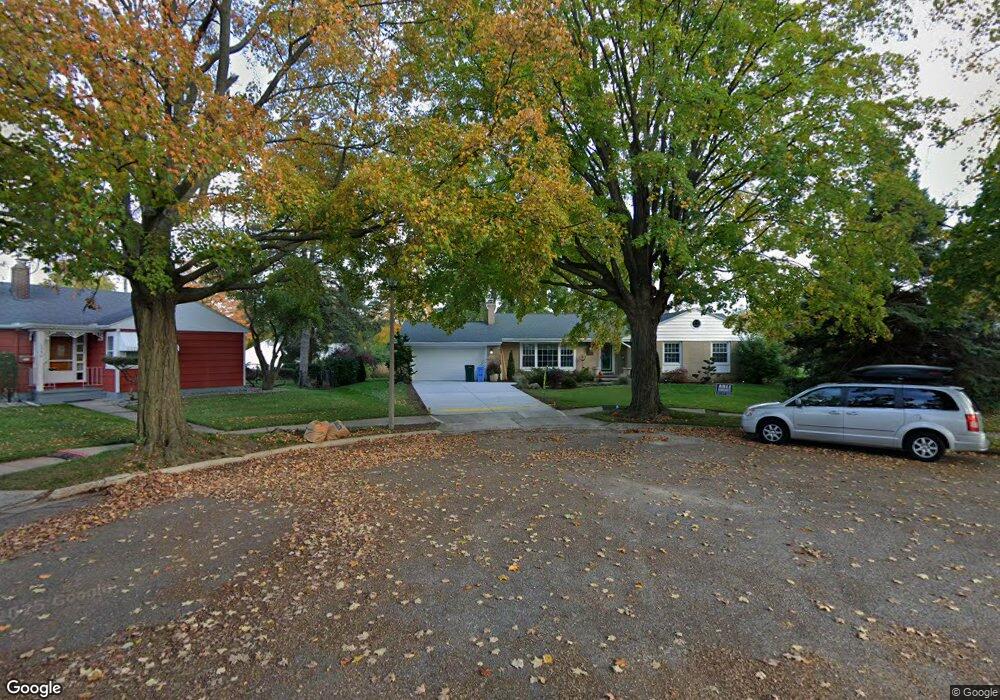
1719 Windsor Place Lansing, MI 48910
Quentin Park NeighborhoodEstimated Value: $240,000 - $296,000
3
Beds
2
Baths
2,600
Sq Ft
$101/Sq Ft
Est. Value
About This Home
This home is located at 1719 Windsor Place, Lansing, MI 48910 and is currently estimated at $261,328, approximately $100 per square foot. 1719 Windsor Place is a home located in Ingham County with nearby schools including Averill Elementary School, Pattengill Academy, and J.W. Sexton High School.
Ownership History
Date
Name
Owned For
Owner Type
Purchase Details
Closed on
Oct 4, 2018
Sold by
Lorraine Viki
Bought by
Lorraine Viki and Pangborn Ethel
Current Estimated Value
Purchase Details
Closed on
May 22, 2009
Sold by
Gulvas Jeff and Gulvas Amy
Bought by
Lorraine Viki
Home Financials for this Owner
Home Financials are based on the most recent Mortgage that was taken out on this home.
Original Mortgage
$119,250
Outstanding Balance
$75,304
Interest Rate
4.84%
Mortgage Type
Purchase Money Mortgage
Estimated Equity
$186,024
Purchase Details
Closed on
Apr 26, 2002
Sold by
Edwards Janice M and Eschbach Janice M
Bought by
Gulvas Jeff
Home Financials for this Owner
Home Financials are based on the most recent Mortgage that was taken out on this home.
Original Mortgage
$150,000
Interest Rate
6.25%
Mortgage Type
Purchase Money Mortgage
Purchase Details
Closed on
Nov 6, 1996
Sold by
Eschbach Janice M
Bought by
Edwards Janice M
Create a Home Valuation Report for This Property
The Home Valuation Report is an in-depth analysis detailing your home's value as well as a comparison with similar homes in the area
Home Values in the Area
Average Home Value in this Area
Purchase History
| Date | Buyer | Sale Price | Title Company |
|---|---|---|---|
| Lorraine Viki | -- | None Available | |
| Lorraine Viki | $132,500 | Tri Title Agency Llc | |
| Gulvas Jeff | $159,000 | -- | |
| Edwards Janice M | -- | -- |
Source: Public Records
Mortgage History
| Date | Status | Borrower | Loan Amount |
|---|---|---|---|
| Open | Lorraine Viki | $119,250 | |
| Previous Owner | Gulvas Jeff | $150,000 |
Source: Public Records
Tax History Compared to Growth
Tax History
| Year | Tax Paid | Tax Assessment Tax Assessment Total Assessment is a certain percentage of the fair market value that is determined by local assessors to be the total taxable value of land and additions on the property. | Land | Improvement |
|---|---|---|---|---|
| 2025 | $5,033 | $124,900 | $17,800 | $107,100 |
| 2024 | $41 | $104,300 | $17,800 | $86,500 |
| 2023 | $4,716 | $97,400 | $17,800 | $79,600 |
| 2022 | $4,245 | $92,300 | $17,200 | $75,100 |
| 2021 | $4,157 | $88,000 | $10,000 | $78,000 |
| 2020 | $4,132 | $84,800 | $12,300 | $72,500 |
| 2019 | $3,965 | $79,800 | $12,300 | $67,500 |
| 2018 | $3,711 | $74,400 | $12,300 | $62,100 |
| 2017 | $3,554 | $74,400 | $12,300 | $62,100 |
| 2016 | $3,398 | $68,400 | $12,300 | $56,100 |
| 2015 | $3,398 | $66,200 | $24,517 | $41,683 |
| 2014 | $3,398 | $64,100 | $24,517 | $39,583 |
Source: Public Records
Map
Nearby Homes
- 1740 Wellington Rd Unit 103
- 1309 Hammond St
- 1516 Moores River Dr
- 1912 Moores River Dr
- 1221 Moores River Dr
- 1315 Goodrich St
- 1120 Alsdorf St
- 1312 W Mount Hope Ave
- 1116 George St
- 1114 Goodrich St
- 1420 Poxson Ave
- 1010 W Barnes Ave
- 2118 Marion Ave
- 917 W Barnes Ave
- 1615 William St
- 2001 S Martin Luther King Junior Blvd
- 2011 S Martin Luther King jr Blvd
- 2000 William St
- 1533 Cambridge Rd
- 817 Middle St
- 1628 Boston Blvd
- 1632 Boston Blvd
- 1622 Boston Blvd
- 1720 Windsor Place
- 1636 Boston Blvd
- 1724 Dover Place
- 1618 Boston Blvd
- 1642 Boston Blvd
- 1731 Windsor Place
- 1724 Windsor Place
- 1639 Wellington Rd
- 1614 Boston Blvd
- 1646 Boston Blvd
- 1619 Wellington Rd
- 1730 Dover Place
- 1608 Boston Blvd
- 1652 Boston Blvd
- 1721 Dover Place
- 1715 Pingree St