Estimated Value: $187,489 - $208,000
4
Beds
2
Baths
1,788
Sq Ft
$110/Sq Ft
Est. Value
About This Home
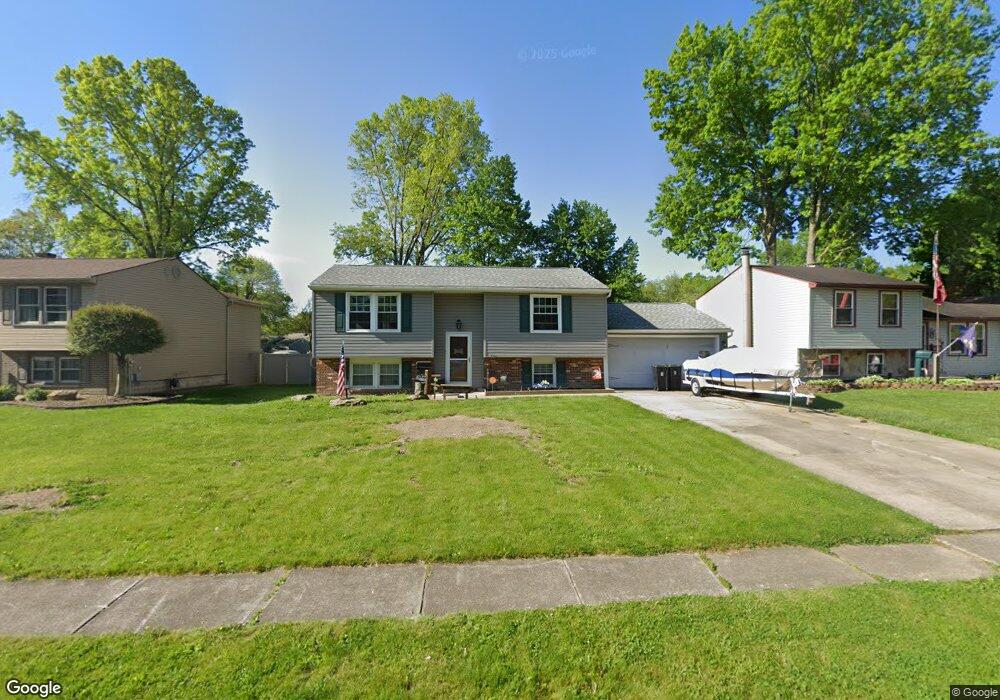
This home is located at 172 Bentwillow Dr, Niles, OH 44446 and is currently estimated at $196,122, approximately $109 per square foot. 172 Bentwillow Dr is a home located in Trumbull County with nearby schools including Niles Primary School, Niles Intermediate School, and Niles Middle School.
Ownership History
Date
Name
Owned For
Owner Type
Purchase Details
Closed on
Jan 5, 2006
Sold by
Holland Jaisan A
Bought by
Guzan Pamela Jo
Current Estimated Value
Home Financials for this Owner
Home Financials are based on the most recent Mortgage that was taken out on this home.
Original Mortgage
$20,600
Interest Rate
5.92%
Mortgage Type
Stand Alone Second
Purchase Details
Closed on
Dec 30, 2005
Sold by
Holland Jaisan A
Bought by
Guzan Pamela Jo
Home Financials for this Owner
Home Financials are based on the most recent Mortgage that was taken out on this home.
Original Mortgage
$20,600
Interest Rate
5.92%
Mortgage Type
Stand Alone Second
Purchase Details
Closed on
Sep 24, 1998
Sold by
Hall Mitchell D and Hall Latrell
Bought by
Holland Jaisan A
Purchase Details
Closed on
Jan 1, 1990
Bought by
Mitchell Mitchell D and Mitchell S
Create a Home Valuation Report for This Property
The Home Valuation Report is an in-depth analysis detailing your home's value as well as a comparison with similar homes in the area
Home Values in the Area
Average Home Value in this Area
Purchase History
| Date | Buyer | Sale Price | Title Company |
|---|---|---|---|
| Guzan Pamela Jo | $103,000 | -- | |
| Guzan Pamela Jo | $103,000 | -- | |
| Holland Jaisan A | $80,000 | -- | |
| Mitchell Mitchell D | -- | -- |
Source: Public Records
Mortgage History
| Date | Status | Borrower | Loan Amount |
|---|---|---|---|
| Closed | Guzan Pamela Jo | $20,600 | |
| Closed | Guzan Pamela Jo | $20,600 |
Source: Public Records
Tax History
| Year | Tax Paid | Tax Assessment Tax Assessment Total Assessment is a certain percentage of the fair market value that is determined by local assessors to be the total taxable value of land and additions on the property. | Land | Improvement |
|---|---|---|---|---|
| 2024 | $1,916 | $45,500 | $5,040 | $40,460 |
| 2023 | $1,898 | $45,500 | $5,040 | $40,460 |
| 2022 | $1,578 | $32,310 | $5,040 | $27,270 |
| 2021 | $1,657 | $32,310 | $5,040 | $27,270 |
| 2020 | $1,672 | $32,310 | $5,040 | $27,270 |
| 2019 | $1,563 | $28,740 | $5,040 | $23,700 |
| 2018 | $1,558 | $28,740 | $5,040 | $23,700 |
| 2017 | $1,549 | $28,740 | $5,040 | $23,700 |
| 2016 | $1,494 | $27,440 | $5,040 | $22,400 |
| 2015 | $1,477 | $27,440 | $5,040 | $22,400 |
| 2014 | $1,482 | $27,440 | $5,040 | $22,400 |
| 2013 | $1,478 | $28,880 | $5,040 | $23,840 |
Source: Public Records
Map
Nearby Homes
- 245 North Rd
- 270 North Rd
- 145 North Rd
- 47 Woodland Chase Blvd Unit 47
- 0 Harrison St
- 27 Wilson Ave
- 1710 Difford Dr
- 1225 Beech St
- 14 Evans St
- 512 John St
- 1004 N Bentley Ave
- 0 Federal
- 1187 Deforest Rd SE
- 1414 Niles Cortland Rd
- 520 Washington Ave
- 1317 Hartzell Ave
- 0 Hughes St SE
- 504 Lincoln Ave
- 820 Hartzell Ave
- 401 Sheridan Ave
- 168 Bentwillow Dr
- 176 Bentwillow Dr
- 180 Bentwillow Dr
- 164 Bentwillow Dr
- 203 Cassandra Dr
- 209 Cassandra Dr
- 197 Cassandra Dr
- 160 Bentwillow Dr
- 184 Bentwillow Dr
- 215 Cassandra Dr
- 173 Bentwillow Dr
- 177 Bentwillow Dr
- 169 Bentwillow Dr
- 185 Bentwillow Dr
- 189 Cassandra Dr
- 165 Bentwillow Dr
- 181 Bentwillow Dr
- 188 Bentwillow Dr
- 156 Bentwillow Dr
- 189 Bentwillow Dr
Your Personal Tour Guide
Ask me questions while you tour the home.