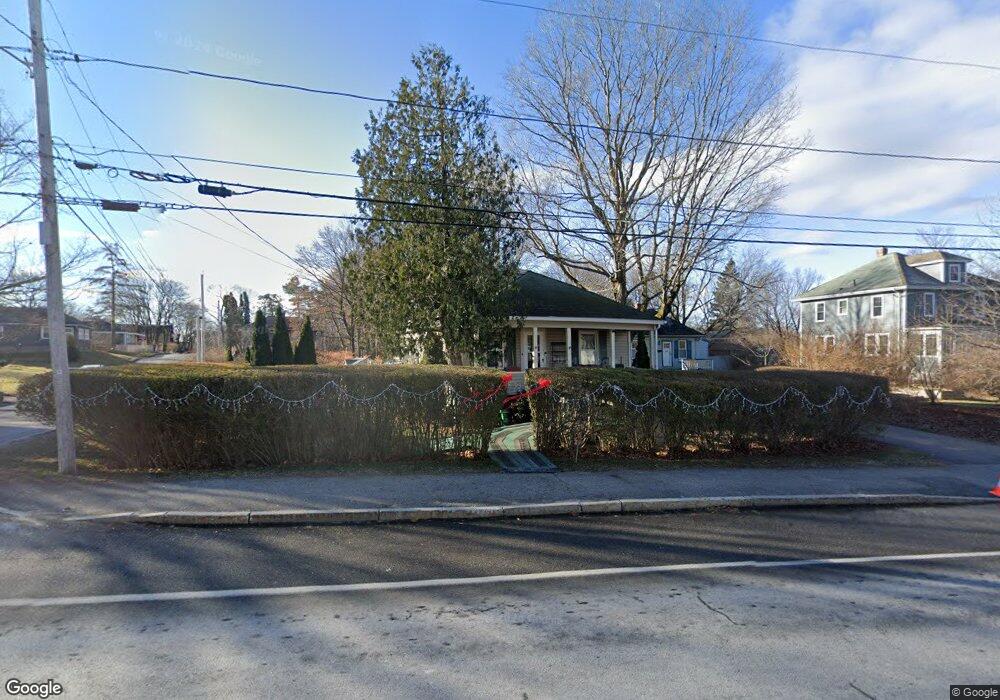
172 Capisic St Portland, ME 04102
Rosemont NeighborhoodEstimated Value: $450,000 - $579,000
3
Beds
2
Baths
1,716
Sq Ft
$303/Sq Ft
Est. Value
About This Home
This home is located at 172 Capisic St, Portland, ME 04102 and is currently estimated at $519,889, approximately $302 per square foot. 172 Capisic St is a home located in Cumberland County with nearby schools including Amanda C Rowe School, Lincoln Middle School, and Breakwater School.
Ownership History
Date
Name
Owned For
Owner Type
Purchase Details
Closed on
Oct 16, 2007
Sold by
Waxler Jane E and Chase Jane E
Bought by
Yattaw Mark W and Yattaw Olga L
Current Estimated Value
Home Financials for this Owner
Home Financials are based on the most recent Mortgage that was taken out on this home.
Original Mortgage
$100,000
Interest Rate
6.49%
Mortgage Type
Purchase Money Mortgage
Create a Home Valuation Report for This Property
The Home Valuation Report is an in-depth analysis detailing your home's value as well as a comparison with similar homes in the area
Home Values in the Area
Average Home Value in this Area
Purchase History
| Date | Buyer | Sale Price | Title Company |
|---|---|---|---|
| Yattaw Mark W | -- | -- |
Source: Public Records
Mortgage History
| Date | Status | Borrower | Loan Amount |
|---|---|---|---|
| Open | Yattaw Mark W | $154,000 | |
| Closed | Yattaw Mark W | $100,000 |
Source: Public Records
Tax History Compared to Growth
Tax History
| Year | Tax Paid | Tax Assessment Tax Assessment Total Assessment is a certain percentage of the fair market value that is determined by local assessors to be the total taxable value of land and additions on the property. | Land | Improvement |
|---|---|---|---|---|
| 2024 | $4,462 | $297,300 | $80,100 | $217,200 |
| 2023 | $4,284 | $297,300 | $80,100 | $217,200 |
| 2022 | $4,046 | $297,300 | $80,100 | $217,200 |
| 2021 | $3,862 | $297,300 | $80,100 | $217,200 |
| 2020 | $4,664 | $200,100 | $57,200 | $142,900 |
| 2019 | $4,664 | $200,100 | $57,200 | $142,900 |
| 2018 | $4,498 | $200,100 | $57,200 | $142,900 |
| 2017 | $4,332 | $200,100 | $57,200 | $142,900 |
| 2016 | $4,224 | $200,100 | $57,200 | $142,900 |
| 2015 | $4,128 | $200,100 | $57,200 | $142,900 |
| 2014 | $4,002 | $200,100 | $57,200 | $142,900 |
Source: Public Records
Map
Nearby Homes
- 159 Bancroft St
- 63A Capisic St
- 1542 Congress St
- 18 Stoneledge Dr
- 4 Fairview St
- 7 Twin Knolls Ln
- 1346 Westbrook St
- 160 Craigie St
- 24 Edwards St
- 162 Hobart St
- 0 Hillcrest Ave
- 6 Highland St
- 89 Cobb Ave
- 296 Brighton Ave
- 37 Tremont St
- 1 Firefly St Unit 402
- 1 Firefly St Unit 201
- 1 Firefly St Unit 303
- 1 Firefly St Unit 302
- 1 Firefly St Unit 403/103