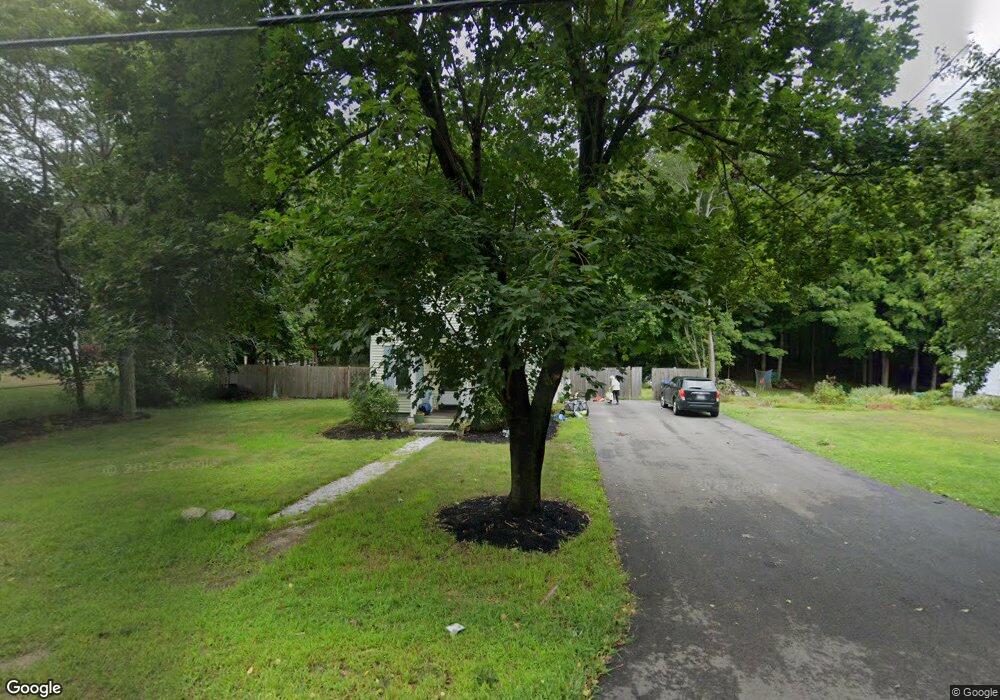
172 Cross St Hanover, MA 02339
Estimated Value: $589,146 - $647,000
3
Beds
1
Bath
1,150
Sq Ft
$533/Sq Ft
Est. Value
About This Home
This home is located at 172 Cross St, Hanover, MA 02339 and is currently estimated at $612,537, approximately $532 per square foot. 172 Cross St is a home located in Plymouth County with nearby schools including Hanover High School, Cadence Academy Preschool - Hanover, and Cardinal Cushing Centers.
Ownership History
Date
Name
Owned For
Owner Type
Purchase Details
Closed on
Jun 30, 2005
Sold by
Hatcher Walter T and Hatcher Priscilla L
Bought by
Manning Patricia
Current Estimated Value
Home Financials for this Owner
Home Financials are based on the most recent Mortgage that was taken out on this home.
Original Mortgage
$265,500
Interest Rate
5.73%
Mortgage Type
Purchase Money Mortgage
Purchase Details
Closed on
Mar 30, 1990
Sold by
Edgewater Landing Rt
Bought by
Manning Patricia
Create a Home Valuation Report for This Property
The Home Valuation Report is an in-depth analysis detailing your home's value as well as a comparison with similar homes in the area
Home Values in the Area
Average Home Value in this Area
Purchase History
| Date | Buyer | Sale Price | Title Company |
|---|---|---|---|
| Manning Patricia | $299,900 | -- | |
| Manning Patricia | $132,900 | -- |
Source: Public Records
Mortgage History
| Date | Status | Borrower | Loan Amount |
|---|---|---|---|
| Open | Manning Patricia | $143,000 | |
| Closed | Manning Patricia | $144,000 | |
| Open | Manning Patricia | $279,800 | |
| Closed | Manning Patricia | $265,500 |
Source: Public Records
Tax History
| Year | Tax Paid | Tax Assessment Tax Assessment Total Assessment is a certain percentage of the fair market value that is determined by local assessors to be the total taxable value of land and additions on the property. | Land | Improvement |
|---|---|---|---|---|
| 2025 | $6,319 | $511,700 | $280,500 | $231,200 |
| 2024 | $6,216 | $484,100 | $280,500 | $203,600 |
| 2023 | $5,945 | $440,700 | $255,200 | $185,500 |
| 2022 | $6,137 | $402,400 | $242,500 | $159,900 |
| 2021 | $9,424 | $357,300 | $197,400 | $159,900 |
| 2020 | $5,976 | $366,400 | $209,000 | $157,400 |
| 2019 | $5,717 | $348,400 | $209,000 | $139,400 |
| 2018 | $5,672 | $348,400 | $209,000 | $139,400 |
| 2017 | $5,260 | $318,400 | $205,100 | $113,300 |
| 2016 | $4,974 | $295,000 | $186,500 | $108,500 |
| 2015 | $4,312 | $267,000 | $172,800 | $94,200 |
Source: Public Records
Map
Nearby Homes
- 114 Graham Hill Dr
- 51 Cervelli Farm Dr
- 37 Dr
- 23 Cervelli Farm Dr
- 38 Cervelli Farm Dr
- 9 Cervelli Farm Dr
- 250 Center St
- 36 Grove St
- 177 Dwelley St
- 339 State St
- 95 Tecumseh Dr
- 108 Waterford Dr
- 35 Sproul Rd
- 430 Brook Bend Rd
- 70 Bardin St
- 51 Farmside Dr
- 139 Fairwood Dr
- 75 School St
- 7 Farmside Dr
- 561 Circuit St
Your Personal Tour Guide
Ask me questions while you tour the home.