Estimated Value: $341,660 - $406,000
5
Beds
4
Baths
2,688
Sq Ft
$142/Sq Ft
Est. Value
About This Home
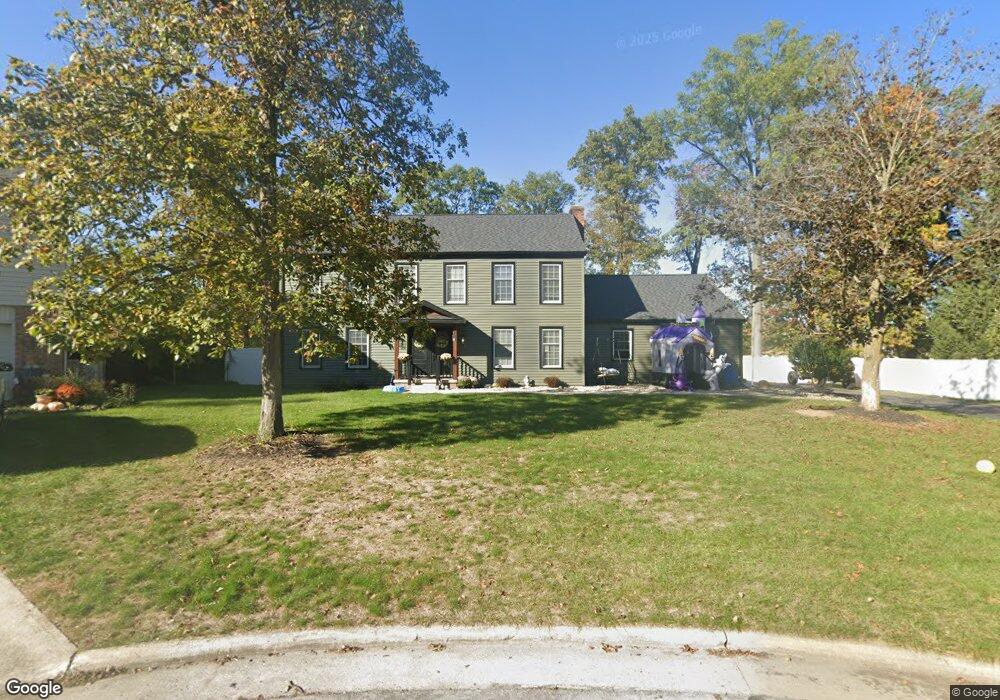
This home is located at 172 Dabill Place, Lima, OH 45805 and is currently estimated at $381,415, approximately $141 per square foot. 172 Dabill Place is a home located in Allen County with nearby schools including Maplewood Elementary School, Elmwood Elementary School, and Shawnee Middle School.
Ownership History
Date
Name
Owned For
Owner Type
Purchase Details
Closed on
Dec 19, 2017
Sold by
Estate Of Andy Ray Shipley and Shipley Andy R
Bought by
Shipley Katrina L
Current Estimated Value
Purchase Details
Closed on
Feb 7, 2011
Sold by
Shipley Katrina
Bought by
Shipley Andy R
Purchase Details
Closed on
Jul 27, 2010
Sold by
Leite Randall W and Leite Theresa H
Bought by
Shipley Andy R
Home Financials for this Owner
Home Financials are based on the most recent Mortgage that was taken out on this home.
Original Mortgage
$180,000
Outstanding Balance
$119,956
Interest Rate
4.7%
Mortgage Type
VA
Estimated Equity
$261,459
Purchase Details
Closed on
Nov 3, 1999
Sold by
Gailbreath Hay A
Bought by
Leite Randall W and Leite Theresa H
Home Financials for this Owner
Home Financials are based on the most recent Mortgage that was taken out on this home.
Original Mortgage
$156,000
Interest Rate
7.78%
Mortgage Type
New Conventional
Purchase Details
Closed on
Mar 1, 1984
Bought by
Gailbreath Hays A
Create a Home Valuation Report for This Property
The Home Valuation Report is an in-depth analysis detailing your home's value as well as a comparison with similar homes in the area
Purchase History
| Date | Buyer | Sale Price | Title Company |
|---|---|---|---|
| Shipley Katrina L | -- | None Available | |
| Shipley Andy R | -- | Attorney | |
| Shipley Andy R | $180,000 | Attorney | |
| Leite Randall W | $195,000 | -- | |
| Gailbreath Hays A | $130,000 | -- |
Source: Public Records
Mortgage History
| Date | Status | Borrower | Loan Amount |
|---|---|---|---|
| Open | Shipley Andy R | $180,000 | |
| Previous Owner | Leite Randall W | $156,000 |
Source: Public Records
Tax History
| Year | Tax Paid | Tax Assessment Tax Assessment Total Assessment is a certain percentage of the fair market value that is determined by local assessors to be the total taxable value of land and additions on the property. | Land | Improvement |
|---|---|---|---|---|
| 2024 | $4,160 | $85,370 | $16,980 | $68,390 |
| 2023 | $3,773 | $68,290 | $13,580 | $54,710 |
| 2022 | $3,802 | $68,290 | $13,580 | $54,710 |
| 2021 | $3,819 | $68,290 | $13,580 | $54,710 |
| 2020 | $3,324 | $68,820 | $12,920 | $55,900 |
| 2019 | $3,324 | $68,820 | $12,920 | $55,900 |
| 2018 | $3,312 | $68,820 | $12,920 | $55,900 |
| 2017 | $2,984 | $60,070 | $12,920 | $47,150 |
| 2016 | $2,958 | $60,070 | $12,920 | $47,150 |
| 2015 | $2,884 | $60,070 | $12,920 | $47,150 |
| 2014 | $2,884 | $57,830 | $11,870 | $45,960 |
| 2013 | $2,829 | $57,830 | $11,870 | $45,960 |
Source: Public Records
Map
Nearby Homes
- 2997 Cletus Pkwy
- 250 Squire Ln
- 1408 Winghaven Dr
- 3071 Canterbury Dr
- 0 Springview Dr
- 3390 Spencerville Rd
- 2921 Canterbury Dr
- 2964 Hanover Dr
- 1453 W Shore Dr
- 1421 Shawnee Rd
- 2949 Lakewood Ave
- 1540 Adak Ave
- 1409 Fulton Rd
- 1635 Tanglewood Ln
- 2072 Arcadia Ave
- 2802 Lowell Ave
- 2700 Lowell Ave
- 206 Eagles Point St E
- XXXX Spencerville Rd
- 123 Eagles Point W
- 160 Dabill Place
- 184 Dabill Place
- 148 Dabill Place
- 185 Dabill Place
- 161 Dabill Place
- N/A Dabill
- 2916 Autumn Leaves Ct
- 136 Dabill Place
- 135 Dabill Place
- 121 Queens Ln
- 124 Dabill Place
- 2820 Spencerville Rd
- 3031 Jenny Place
- 3011 Jenny Place
- 2946 Autumn Leaves
- 3051 Jenny Place
- 3071 Jenny Place
- 0 Dabill Place
Your Personal Tour Guide
Ask me questions while you tour the home.