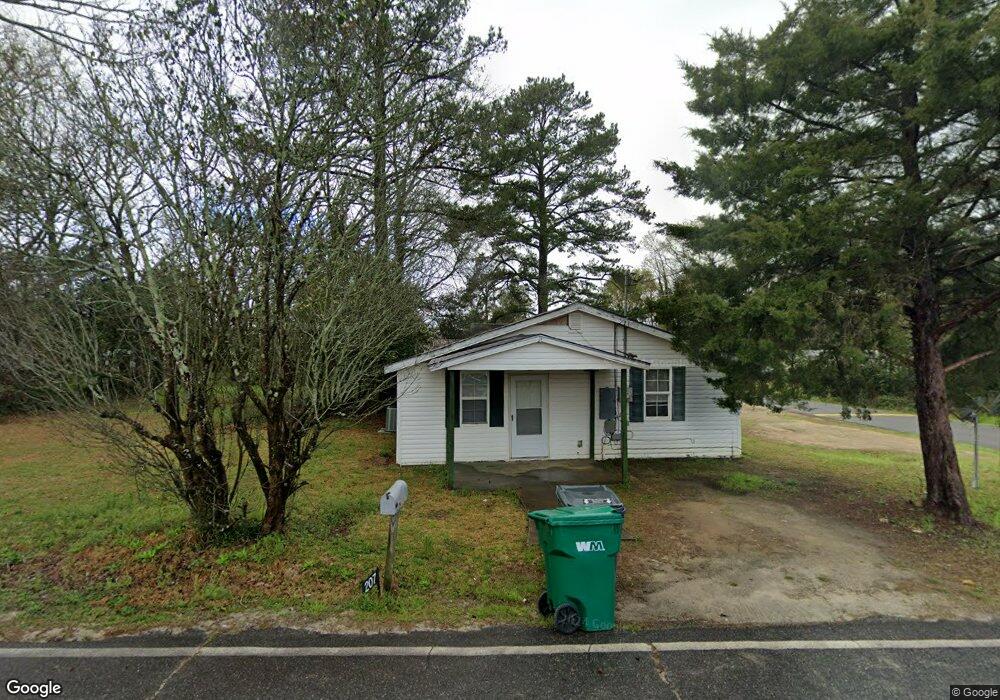
172 Dinah St Cochran, GA 31014
Estimated Value: $74,000 - $164,000
2
Beds
2
Baths
960
Sq Ft
$116/Sq Ft
Est. Value
About This Home
This home is located at 172 Dinah St, Cochran, GA 31014 and is currently estimated at $111,794, approximately $116 per square foot. 172 Dinah St is a home located in Bleckley County with nearby schools including Bleckley County Primary School, Bleckley County Elementary School, and Bleckley Middle School.
Ownership History
Date
Name
Owned For
Owner Type
Purchase Details
Closed on
Apr 15, 2022
Sold by
J Five Grp Llc
Bought by
Lawson Vanessa
Current Estimated Value
Home Financials for this Owner
Home Financials are based on the most recent Mortgage that was taken out on this home.
Original Mortgage
$57,375
Interest Rate
3.85%
Mortgage Type
New Conventional
Purchase Details
Closed on
Jan 13, 2017
Bought by
J Five Grp Llc
Purchase Details
Closed on
Oct 4, 2016
Sold by
C L
Bought by
State Bank Of Cochran
Purchase Details
Closed on
Jan 4, 2008
Sold by
Johnson L C
Bought by
Johnson L C
Purchase Details
Closed on
Dec 16, 2000
Sold by
Dennis Bland
Bought by
West Nathaniel
Purchase Details
Closed on
Jan 28, 1951
Bought by
Collins Frank L and Collins Mr
Create a Home Valuation Report for This Property
The Home Valuation Report is an in-depth analysis detailing your home's value as well as a comparison with similar homes in the area
Home Values in the Area
Average Home Value in this Area
Purchase History
| Date | Buyer | Sale Price | Title Company |
|---|---|---|---|
| Lawson Vanessa | $60,000 | -- | |
| J Five Grp Llc | $56,742 | -- | |
| State Bank Of Cochran | -- | -- | |
| Johnson L C | $65,000 | -- | |
| West Nathaniel | $12,500 | -- | |
| Dennis Bland | -- | -- | |
| Collins Frank L | -- | -- |
Source: Public Records
Mortgage History
| Date | Status | Borrower | Loan Amount |
|---|---|---|---|
| Closed | Lawson Vanessa | $57,375 |
Source: Public Records
Tax History Compared to Growth
Tax History
| Year | Tax Paid | Tax Assessment Tax Assessment Total Assessment is a certain percentage of the fair market value that is determined by local assessors to be the total taxable value of land and additions on the property. | Land | Improvement |
|---|---|---|---|---|
| 2024 | $1,116 | $29,612 | $372 | $29,240 |
| 2023 | $2,231 | $54,612 | $372 | $54,240 |
| 2022 | $1,308 | $48,080 | $600 | $47,480 |
| 2021 | $1,012 | $35,640 | $600 | $35,040 |
| 2020 | $804 | $39,720 | $600 | $39,120 |
| 2019 | $804 | $28,202 | $1,200 | $27,002 |
| 2018 | $1,140 | $28,202 | $1,200 | $27,002 |
| 2017 | $814 | $28,202 | $1,200 | $27,002 |
| 2016 | $1,003 | $28,202 | $1,200 | $27,002 |
| 2015 | -- | $28,202 | $1,200 | $27,002 |
| 2014 | -- | $28,202 | $1,200 | $27,002 |
| 2013 | -- | $28,202 | $1,200 | $27,002 |
Source: Public Records
Map
Nearby Homes