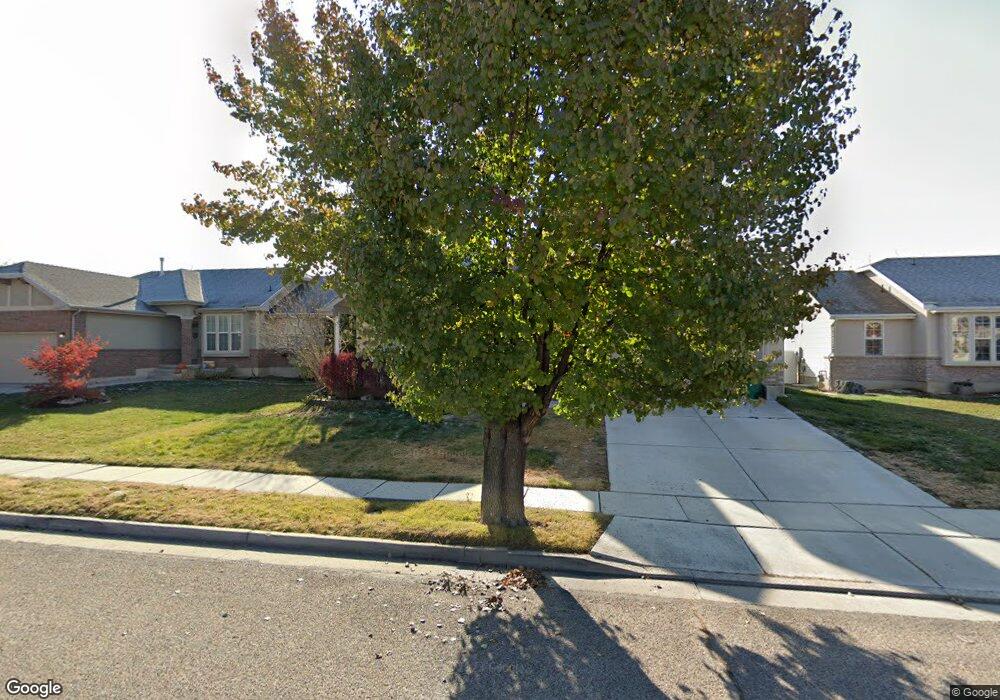
172 E 2400 S Clearfield, UT 84015
Estimated Value: $428,000 - $516,000
3
Beds
2
Baths
1,743
Sq Ft
$265/Sq Ft
Est. Value
About This Home
This home is located at 172 E 2400 S, Clearfield, UT 84015 and is currently estimated at $461,952, approximately $265 per square foot. 172 E 2400 S is a home located in Davis County with nearby schools including Antelope Elementary School, North Davis Junior High School, and Clearfield High School.
Ownership History
Date
Name
Owned For
Owner Type
Purchase Details
Closed on
May 1, 2020
Sold by
Stevenson Glenn T and Stevenson Christine L
Bought by
Stem Barbara A
Current Estimated Value
Home Financials for this Owner
Home Financials are based on the most recent Mortgage that was taken out on this home.
Original Mortgage
$289,750
Outstanding Balance
$257,644
Interest Rate
3.6%
Mortgage Type
New Conventional
Estimated Equity
$204,308
Purchase Details
Closed on
Jun 12, 2006
Sold by
Balla Cindi R
Bought by
Stevenson Glenn T and Stevenson Christine L
Home Financials for this Owner
Home Financials are based on the most recent Mortgage that was taken out on this home.
Original Mortgage
$30,000
Interest Rate
6.19%
Mortgage Type
Purchase Money Mortgage
Purchase Details
Closed on
Jul 17, 2003
Sold by
Haskell Homes Inc
Bought by
Balla Cindi R
Home Financials for this Owner
Home Financials are based on the most recent Mortgage that was taken out on this home.
Original Mortgage
$145,656
Interest Rate
5.18%
Mortgage Type
VA
Create a Home Valuation Report for This Property
The Home Valuation Report is an in-depth analysis detailing your home's value as well as a comparison with similar homes in the area
Home Values in the Area
Average Home Value in this Area
Purchase History
| Date | Buyer | Sale Price | Title Company |
|---|---|---|---|
| Stem Barbara A | -- | Mountain View Title | |
| Stevenson Glenn T | -- | Us Title Company Of Utah | |
| Balla Cindi R | -- | Bonneville Title Company Inc |
Source: Public Records
Mortgage History
| Date | Status | Borrower | Loan Amount |
|---|---|---|---|
| Open | Stem Barbara A | $289,750 | |
| Previous Owner | Stevenson Glenn T | $30,000 | |
| Previous Owner | Balla Cindi R | $145,656 |
Source: Public Records
Tax History
| Year | Tax Paid | Tax Assessment Tax Assessment Total Assessment is a certain percentage of the fair market value that is determined by local assessors to be the total taxable value of land and additions on the property. | Land | Improvement |
|---|---|---|---|---|
| 2025 | $2,498 | $223,850 | $67,035 | $156,815 |
| 2024 | $2,431 | $219,450 | $64,124 | $155,326 |
| 2023 | $2,227 | $369,000 | $103,126 | $265,874 |
| 2022 | $2,547 | $228,250 | $59,561 | $168,689 |
| 2021 | $2,282 | $309,000 | $60,725 | $248,275 |
| 2020 | $1,978 | $266,000 | $50,600 | $215,400 |
| 2019 | $1,914 | $254,000 | $54,780 | $199,220 |
| 2018 | $1,771 | $229,000 | $48,623 | $180,377 |
| 2016 | $1,543 | $104,335 | $19,251 | $85,084 |
| 2015 | $1,504 | $96,965 | $19,251 | $77,714 |
| 2014 | $1,439 | $94,025 | $19,251 | $74,774 |
| 2013 | -- | $77,862 | $27,299 | $50,563 |
Source: Public Records
Map
Nearby Homes
- 1250 N 2925 W
- 195 E 2325 S
- 2480 S Main St
- 2345 S Main St
- 3250 W 1075 N
- 3389 W Gordon Ave
- 816 N 2700 W
- 1186 N 2425 W
- 1969 S 575 E
- 1141 N 2275 W
- 369 W 1900 S
- 1877 S 725 E
- 460 E 1700 S Unit 1 & 2
- 906 E Sam Cir
- 1685 S 245 W
- 841 N 2175 W
- 273 N 2975 W
- 867 N 2125 W
- 1876 W 1575 N Unit 237
- 1570 N 1875 W Unit 242
Your Personal Tour Guide
Ask me questions while you tour the home.