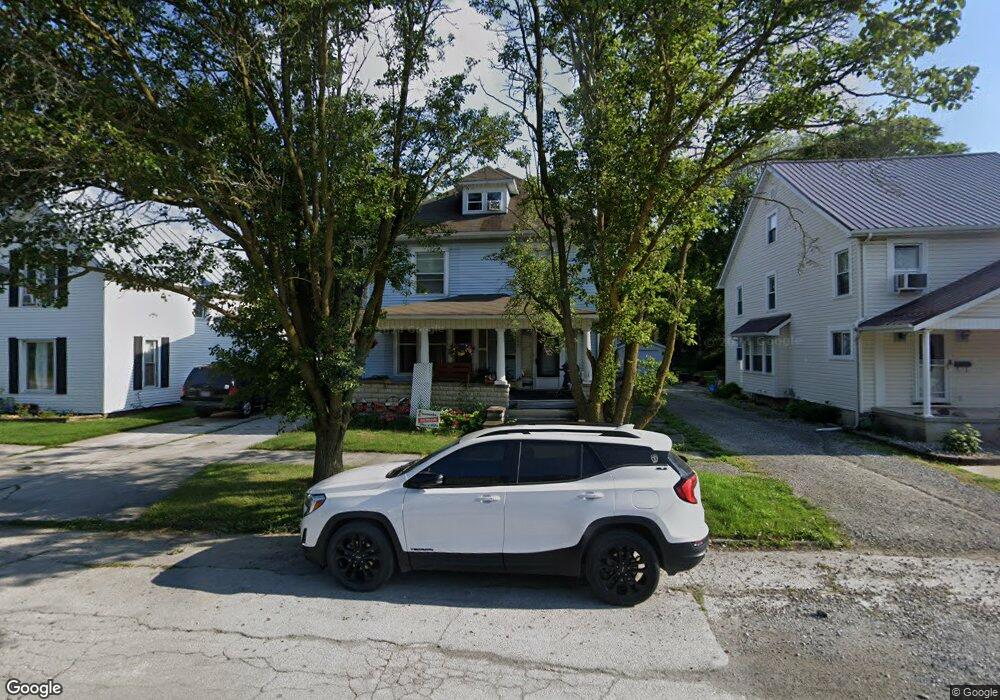
172 E Fremont St Fostoria, OH 44830
Estimated Value: $74,000 - $118,000
3
Beds
1
Bath
1,244
Sq Ft
$79/Sq Ft
Est. Value
About This Home
This home is located at 172 E Fremont St, Fostoria, OH 44830 and is currently estimated at $97,670, approximately $78 per square foot. 172 E Fremont St is a home located in Seneca County with nearby schools including Fostoria Intermediate Elementary School and Fostoria Junior/Senior High School.
Ownership History
Date
Name
Owned For
Owner Type
Purchase Details
Closed on
Mar 20, 2020
Sold by
Rochester James R
Bought by
Moore Rachelle M
Current Estimated Value
Home Financials for this Owner
Home Financials are based on the most recent Mortgage that was taken out on this home.
Original Mortgage
$62,626
Outstanding Balance
$55,359
Interest Rate
3.4%
Mortgage Type
New Conventional
Estimated Equity
$42,312
Purchase Details
Closed on
Aug 4, 2003
Sold by
Steve Bertha V
Bought by
Rochester James R
Purchase Details
Closed on
Dec 14, 1999
Bought by
Steve Bertha
Create a Home Valuation Report for This Property
The Home Valuation Report is an in-depth analysis detailing your home's value as well as a comparison with similar homes in the area
Home Values in the Area
Average Home Value in this Area
Purchase History
| Date | Buyer | Sale Price | Title Company |
|---|---|---|---|
| Moore Rachelle M | $62,000 | Golden Key Title Agency | |
| Rochester James R | $32,000 | -- | |
| Steve Bertha | -- | -- |
Source: Public Records
Mortgage History
| Date | Status | Borrower | Loan Amount |
|---|---|---|---|
| Open | Moore Rachelle M | $62,626 |
Source: Public Records
Tax History Compared to Growth
Tax History
| Year | Tax Paid | Tax Assessment Tax Assessment Total Assessment is a certain percentage of the fair market value that is determined by local assessors to be the total taxable value of land and additions on the property. | Land | Improvement |
|---|---|---|---|---|
| 2024 | $918 | $18,140 | $990 | $17,150 |
| 2023 | $919 | $18,140 | $990 | $17,150 |
| 2022 | $976 | $17,160 | $890 | $16,270 |
| 2021 | $491 | $17,160 | $890 | $16,270 |
| 2020 | $493 | $17,157 | $889 | $16,268 |
| 2019 | $368 | $14,952 | $798 | $14,154 |
| 2018 | $375 | $14,952 | $798 | $14,154 |
| 2017 | $374 | $14,952 | $798 | $14,154 |
| 2016 | $242 | $13,248 | $896 | $12,352 |
| 2015 | $238 | $13,248 | $896 | $12,352 |
| 2014 | $227 | $13,248 | $896 | $12,352 |
| 2013 | $303 | $14,350 | $973 | $13,377 |
Source: Public Records
Map
Nearby Homes
- 220 E High St
- 321 Mcdougal St
- 540 N Poplar St
- 412 E Center St
- 633 Maple St
- 520 N Union St
- 133 E South St
- 0 W South Route 12
- 203 N Union St
- 429 S Town St
- 723 N Union St
- 711 Circle Dr
- 481 Beverly Dr
- 827 Buckley St
- 348 W South St
- 931 N Union St
- 351 W South St
- 509 College Ave
- 207 W Culbertson St
- 892 N Countyline St
- 172 E Fremont St
- 168 E Fremont St
- 176 E Fremont St
- 162 E Fremont St
- 154 E Fremont St
- 301 E High St
- 231 E High St
- 303 E High St
- 152 E Fremont St
- 167 E Fremont St
- 225 E High St
- 157 E Fremont St
- 148 E Fremont St
- 219 E High St
- 227 E High St
- 231 Sandusky St
- 227 Sandusky St
- 203 E Fremont St
- 219 Sandusky St
- 223 Sandusky St