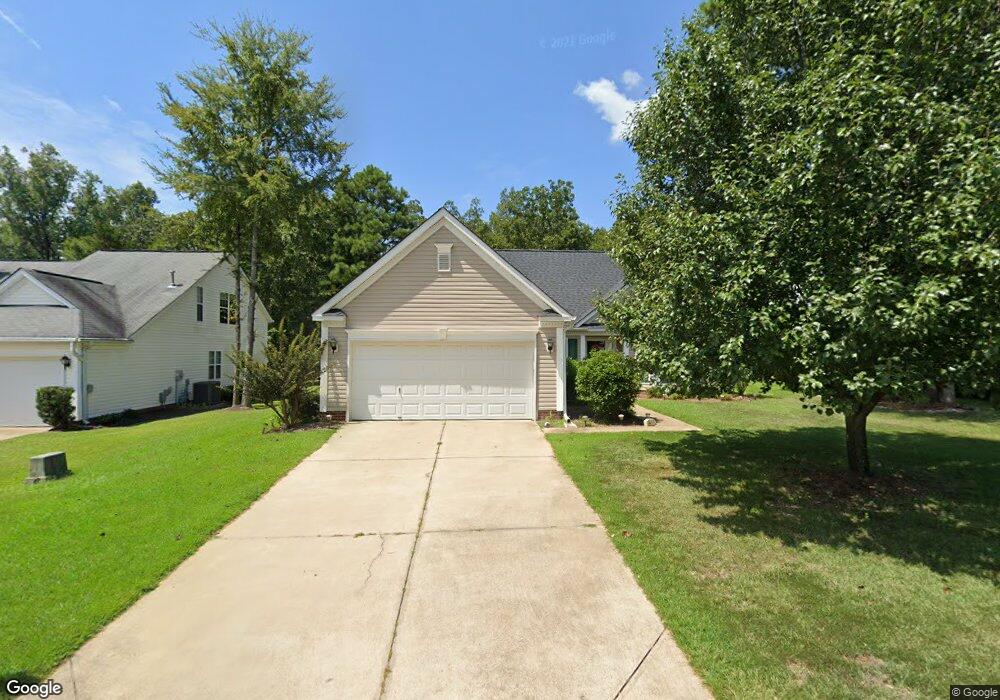
172 Eagle Pointe Dr Chapin, SC 29036
Estimated Value: $260,000 - $315,000
4
Beds
2
Baths
1,771
Sq Ft
$159/Sq Ft
Est. Value
About This Home
This home is located at 172 Eagle Pointe Dr, Chapin, SC 29036 and is currently estimated at $280,957, approximately $158 per square foot. 172 Eagle Pointe Dr is a home located in Lexington County with nearby schools including Chapin Elementary School, Chapin Intermediate, and Chapin High School.
Ownership History
Date
Name
Owned For
Owner Type
Purchase Details
Closed on
Nov 2, 2021
Sold by
Demarco Marilynn and Demarco Anthony W
Bought by
Amick William K and Amick Wanda D
Current Estimated Value
Home Financials for this Owner
Home Financials are based on the most recent Mortgage that was taken out on this home.
Original Mortgage
$188,800
Outstanding Balance
$172,737
Interest Rate
2.88%
Mortgage Type
New Conventional
Estimated Equity
$108,220
Purchase Details
Closed on
Dec 22, 2017
Sold by
Smith Mary Lou
Bought by
Demarco Marilynn and Demarco Anthony W
Purchase Details
Closed on
Oct 29, 2010
Sold by
Smith Herbert L
Bought by
Smith Mary Lou
Purchase Details
Closed on
Dec 29, 2005
Sold by
Hatch Susan L and Yates Susan L
Bought by
Smith Herbert L and Smith Mary Lou
Purchase Details
Closed on
Jan 15, 2004
Sold by
Beazer Homes Corp
Bought by
Hatch Susan L
Create a Home Valuation Report for This Property
The Home Valuation Report is an in-depth analysis detailing your home's value as well as a comparison with similar homes in the area
Home Values in the Area
Average Home Value in this Area
Purchase History
| Date | Buyer | Sale Price | Title Company |
|---|---|---|---|
| Amick William K | $240,000 | None Available | |
| Demarco Marilynn | $150,000 | None Available | |
| Smith Mary Lou | -- | -- | |
| Smith Herbert L | $158,000 | None Available | |
| Hatch Susan L | $135,640 | -- |
Source: Public Records
Mortgage History
| Date | Status | Borrower | Loan Amount |
|---|---|---|---|
| Open | Amick William K | $188,800 |
Source: Public Records
Tax History
| Year | Tax Paid | Tax Assessment Tax Assessment Total Assessment is a certain percentage of the fair market value that is determined by local assessors to be the total taxable value of land and additions on the property. | Land | Improvement |
|---|---|---|---|---|
| 2024 | $1,026 | $9,600 | $1,000 | $8,600 |
| 2023 | $1,077 | $9,600 | $1,000 | $8,600 |
| 2022 | $1,101 | $9,600 | $1,000 | $8,600 |
| 2020 | $590 | $6,086 | $1,000 | $5,086 |
| 2019 | $987 | $6,000 | $1,000 | $5,000 |
| 2018 | $869 | $6,000 | $1,000 | $5,000 |
| 2017 | $359 | $5,047 | $1,000 | $4,047 |
| 2016 | $377 | $5,047 | $1,000 | $4,047 |
| 2014 | $442 | $5,490 | $1,000 | $4,490 |
| 2013 | -- | $5,490 | $1,000 | $4,490 |
Source: Public Records
Map
Nearby Homes
- 392 Eagle Pointe Dr
- 814 Dutchmaster Dr
- 147 State Road S-32-716
- 160 State Road S-32-716
- 368 Frick Ct
- 192 Palm St
- 720 Topline St
- 1661 Old Lexington Hwy
- 339 Newberg Rd
- 153 Rushton Dr
- 1533 Saugus Ct
- 312 Throne Ct
- 366 Gallery Cliff Dr
- 134 Walkbridge Way
- 512 Stucks Point Dr
- 512 Old Bush River Rd
- 228 Bickley View Ct
- 271 Bickley View Ct
- 0 Dreher Island Rd Unit 21647709
- 0 Dreher Island Rd Unit 587193
- 168 Eagle Pointe Dr
- 176 Eagle Pointe Dr
- 164 Eagle Pointe Dr
- 180 Eagle Pointe Dr
- 160 Eagle Pointe Dr
- 177 Eagle Pointe Dr
- 184 Eagle Pointe Dr
- 156 Eagle Pointe Dr
- 101 Wingspan Way
- 188 Eagle Pointe Dr
- 203 Eagle Pointe Dr
- 192 Eagle Pointe Dr
- 200 Eagle Pointe Dr
- 155 Eagle Pointe Dr
- 108 Wingspan Way
- 205 Eagle Pointe Dr
- 105 Wingspan Way
- 202 Eagle Pointe Dr
- 148 Eagle Pointe Dr
- 112 Wingspan Way
Your Personal Tour Guide
Ask me questions while you tour the home.