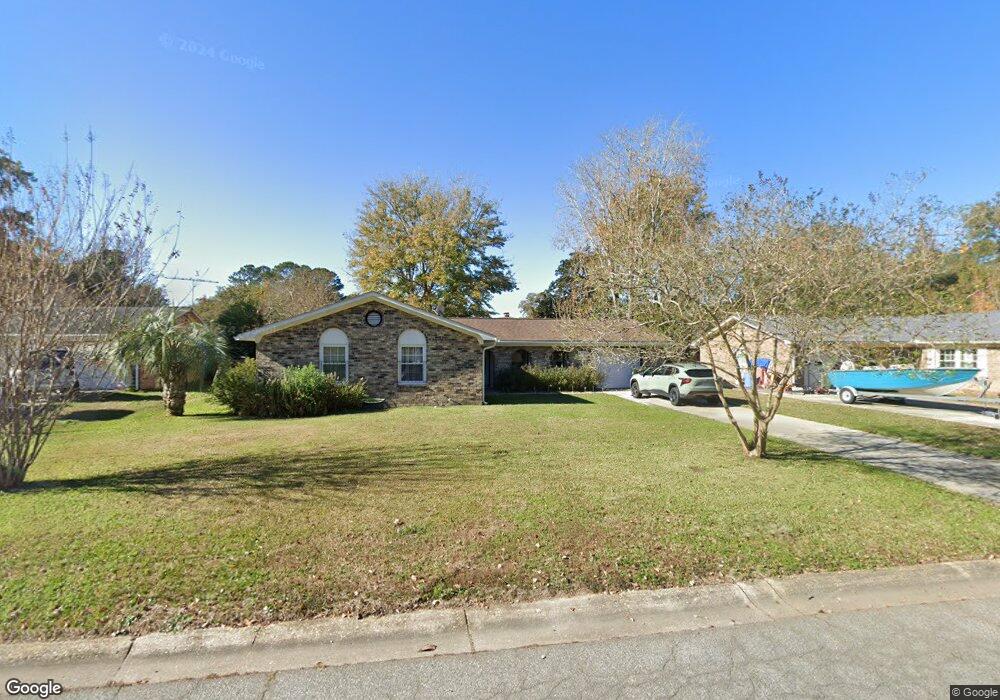
172 Foxborough Rd Goose Creek, SC 29445
Estimated Value: $290,000 - $307,452
--
Bed
--
Bath
1,435
Sq Ft
$210/Sq Ft
Est. Value
About This Home
This home is located at 172 Foxborough Rd, Goose Creek, SC 29445 and is currently estimated at $300,863, approximately $209 per square foot. 172 Foxborough Rd is a home located in Berkeley County with nearby schools including Westview Primary School, Westview Elementary School, and Westview Middle School.
Ownership History
Date
Name
Owned For
Owner Type
Purchase Details
Closed on
Oct 14, 2008
Sold by
Dunahoe Charles
Bought by
Hancock Jamie L
Current Estimated Value
Purchase Details
Closed on
Jan 31, 2007
Sold by
Simpson Charles Edward
Bought by
Hancock Jami L and Dunahoe Charles
Home Financials for this Owner
Home Financials are based on the most recent Mortgage that was taken out on this home.
Original Mortgage
$34,000
Outstanding Balance
$20,262
Interest Rate
6.07%
Mortgage Type
Stand Alone Second
Estimated Equity
$280,601
Purchase Details
Closed on
Mar 24, 2005
Sold by
Butler Jimmie Allen
Bought by
Simpson Charles Edward
Home Financials for this Owner
Home Financials are based on the most recent Mortgage that was taken out on this home.
Original Mortgage
$140,070
Interest Rate
5.54%
Mortgage Type
Future Advance Clause Open End Mortgage
Purchase Details
Closed on
Sep 18, 2002
Sold by
Butler Harriet H
Bought by
Butler Jimmie Allen
Create a Home Valuation Report for This Property
The Home Valuation Report is an in-depth analysis detailing your home's value as well as a comparison with similar homes in the area
Home Values in the Area
Average Home Value in this Area
Purchase History
| Date | Buyer | Sale Price | Title Company |
|---|---|---|---|
| Hancock Jamie L | -- | -- | |
| Hancock Jami L | $170,000 | None Available | |
| Simpson Charles Edward | $142,000 | -- | |
| Butler Jimmie Allen | -- | -- |
Source: Public Records
Mortgage History
| Date | Status | Borrower | Loan Amount |
|---|---|---|---|
| Open | Hancock Jami L | $34,000 | |
| Previous Owner | Simpson Charles Edward | $140,070 |
Source: Public Records
Tax History Compared to Growth
Tax History
| Year | Tax Paid | Tax Assessment Tax Assessment Total Assessment is a certain percentage of the fair market value that is determined by local assessors to be the total taxable value of land and additions on the property. | Land | Improvement |
|---|---|---|---|---|
| 2025 | $787 | $168,222 | $32,955 | $135,267 |
| 2024 | $787 | $6,729 | $1,318 | $5,411 |
| 2023 | $787 | $6,729 | $1,318 | $5,411 |
| 2022 | $735 | $5,851 | $1,190 | $4,661 |
| 2021 | $782 | $5,850 | $1,190 | $4,661 |
| 2020 | $1,000 | $5,851 | $1,190 | $4,661 |
| 2019 | $953 | $5,851 | $1,190 | $4,661 |
| 2018 | $873 | $5,088 | $1,200 | $3,888 |
| 2017 | $867 | $5,088 | $1,200 | $3,888 |
| 2016 | $873 | $5,090 | $1,200 | $3,890 |
| 2015 | $825 | $5,090 | $1,200 | $3,890 |
| 2014 | $774 | $5,090 | $1,200 | $3,890 |
| 2013 | -- | $5,090 | $1,200 | $3,890 |
Source: Public Records
Map
Nearby Homes
- 105 Barrington Blvd
- 102 Barrington Blvd
- 11 Hunters Ct
- 216 Foxborough Rd
- 246 Foxborough Rd
- 111 Bassett Ct
- 102 Brush Blvd
- Lot 3 Thurgood Dr
- 128 Foxborough Rd
- 215 Woodland Lakes Rd
- 119 Stratford Dr
- 107 Guildford Dr
- 105 Shelton Ln
- 204 Cane Break Ln
- 102 Amberside Dr
- 136 Harrow Place
- 110 Red Cypress Dr
- 113 Rockdale Ln
- 111 Prentice Cir
- 369 Old Mount Holly Rd
- 174 Foxborough Rd
- 170 Foxborough Rd
- 107 Berkshire Ct
- 105 Berkshire Ct
- 109 Berkshire Ct
- 176 Foxborough Rd
- 168 Foxborough Rd
- 103 Berkshire Ct
- 175 Foxborough Rd
- 173 Foxborough Rd
- 177 Foxborough Rd
- 122 Barrington Blvd
- 111 Berkshire Ct
- 166 Foxborough Rd
- 171 Foxborough Rd
- 120 Barrington Blvd
- 169 Foxborough Rd
- 110 Berkshire Ct
- 106 Berkshire Ct
- 104 Berkshire Ct