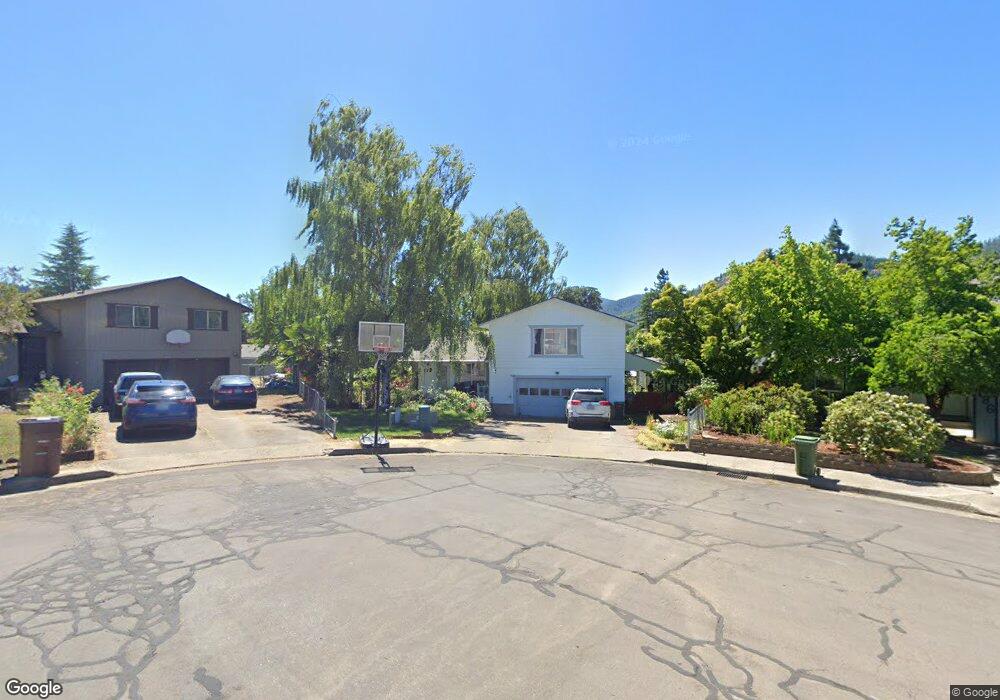
172 Jack Ct Myrtle Creek, OR 97457
Estimated Value: $338,738 - $391,000
3
Beds
2
Baths
1,986
Sq Ft
$187/Sq Ft
Est. Value
About This Home
This home is located at 172 Jack Ct, Myrtle Creek, OR 97457 and is currently estimated at $371,185, approximately $186 per square foot. 172 Jack Ct is a home located in Douglas County with nearby schools including South Umpqua High School.
Ownership History
Date
Name
Owned For
Owner Type
Purchase Details
Closed on
Aug 17, 2004
Sold by
Ireland Patrick
Bought by
Gianotti David F and Gianotti Tapaita F
Current Estimated Value
Home Financials for this Owner
Home Financials are based on the most recent Mortgage that was taken out on this home.
Original Mortgage
$143,000
Outstanding Balance
$69,763
Interest Rate
5.97%
Mortgage Type
Purchase Money Mortgage
Estimated Equity
$301,422
Purchase Details
Closed on
Apr 30, 2004
Sold by
Buchman Theron Roshell
Bought by
Buchman Elizabeth Thelma
Create a Home Valuation Report for This Property
The Home Valuation Report is an in-depth analysis detailing your home's value as well as a comparison with similar homes in the area
Home Values in the Area
Average Home Value in this Area
Purchase History
| Date | Buyer | Sale Price | Title Company |
|---|---|---|---|
| Gianotti David F | $143,000 | Amerititle Inc | |
| Buchman Elizabeth Thelma | -- | -- |
Source: Public Records
Mortgage History
| Date | Status | Borrower | Loan Amount |
|---|---|---|---|
| Open | Gianotti David F | $143,000 |
Source: Public Records
Tax History
| Year | Tax Paid | Tax Assessment Tax Assessment Total Assessment is a certain percentage of the fair market value that is determined by local assessors to be the total taxable value of land and additions on the property. | Land | Improvement |
|---|---|---|---|---|
| 2025 | $2,053 | $215,907 | -- | -- |
| 2024 | $1,998 | $209,619 | -- | -- |
| 2023 | $1,937 | $203,514 | $0 | $0 |
| 2022 | $1,893 | $197,587 | $0 | $0 |
| 2021 | $1,829 | $191,833 | $0 | $0 |
| 2020 | $1,778 | $186,246 | $0 | $0 |
| 2019 | $1,740 | $180,822 | $0 | $0 |
| 2018 | $1,692 | $175,556 | $0 | $0 |
| 2017 | $1,549 | $170,443 | $0 | $0 |
| 2016 | $1,476 | $165,479 | $0 | $0 |
| 2015 | $1,436 | $160,660 | $0 | $0 |
| 2014 | $1,461 | $155,981 | $0 | $0 |
| 2013 | -- | $151,438 | $0 | $0 |
Source: Public Records
Map
Nearby Homes
Your Personal Tour Guide
Ask me questions while you tour the home.