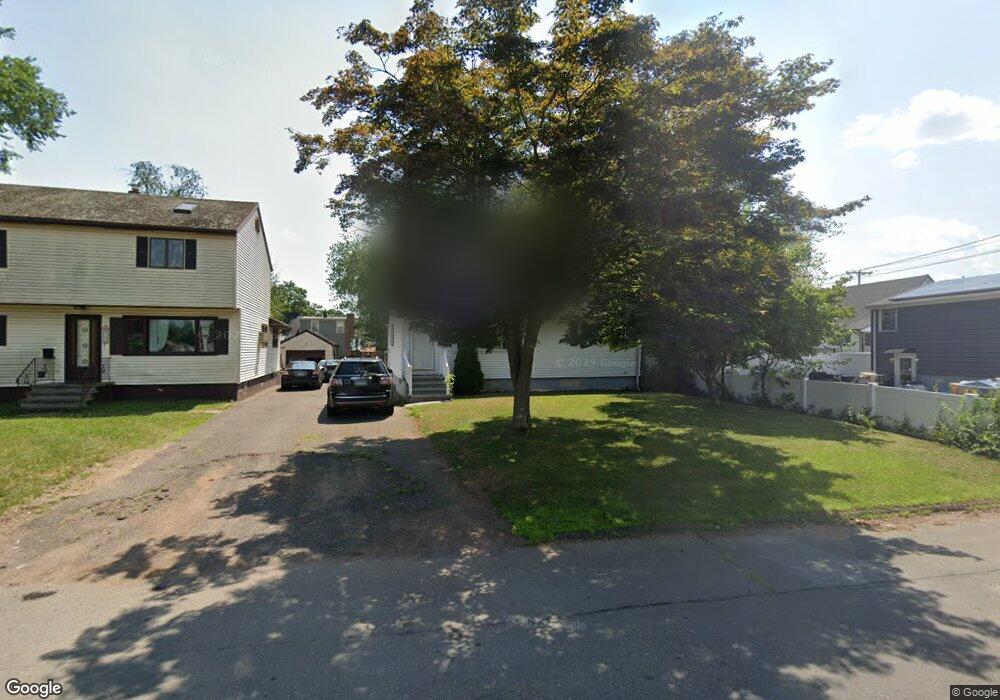
172 Kenneth St East Haven, CT 06512
Estimated Value: $287,000 - $322,000
2
Beds
1
Bath
952
Sq Ft
$323/Sq Ft
Est. Value
About This Home
This home is located at 172 Kenneth St, East Haven, CT 06512 and is currently estimated at $307,899, approximately $323 per square foot. 172 Kenneth St is a home located in New Haven County with nearby schools including East Haven High School, Cold Spring School, and Pathway School.
Ownership History
Date
Name
Owned For
Owner Type
Purchase Details
Closed on
Dec 9, 2010
Sold by
Skeens Shirley
Bought by
Demayo Kimberly E
Current Estimated Value
Home Financials for this Owner
Home Financials are based on the most recent Mortgage that was taken out on this home.
Original Mortgage
$135,400
Outstanding Balance
$89,660
Interest Rate
3.75%
Mortgage Type
FHA
Estimated Equity
$218,239
Purchase Details
Closed on
May 11, 2004
Sold by
Danz Michael W and Danz Gena M
Bought by
Skeens Shirley
Purchase Details
Closed on
Sep 19, 2001
Sold by
Albino Antoinette C
Bought by
Danz Michael W and Danz Gena M
Purchase Details
Closed on
Dec 31, 1997
Sold by
Scalese Robert J
Bought by
Albino Antoinette C
Purchase Details
Closed on
Mar 16, 1990
Sold by
Velardi Frank B
Bought by
Scalesse Robert J
Create a Home Valuation Report for This Property
The Home Valuation Report is an in-depth analysis detailing your home's value as well as a comparison with similar homes in the area
Home Values in the Area
Average Home Value in this Area
Purchase History
| Date | Buyer | Sale Price | Title Company |
|---|---|---|---|
| Demayo Kimberly E | $139,000 | -- | |
| Skeens Shirley | $162,000 | -- | |
| Danz Michael W | $125,000 | -- | |
| Albino Antoinette C | $105,000 | -- | |
| Scalesse Robert J | $60,000 | -- |
Source: Public Records
Mortgage History
| Date | Status | Borrower | Loan Amount |
|---|---|---|---|
| Open | Scalesse Robert J | $135,400 | |
| Closed | Scalesse Robert J | $10,000 |
Source: Public Records
Tax History Compared to Growth
Tax History
| Year | Tax Paid | Tax Assessment Tax Assessment Total Assessment is a certain percentage of the fair market value that is determined by local assessors to be the total taxable value of land and additions on the property. | Land | Improvement |
|---|---|---|---|---|
| 2025 | $4,773 | $142,730 | $47,110 | $95,620 |
| 2024 | $4,773 | $142,730 | $47,110 | $95,620 |
| 2023 | $4,453 | $142,730 | $47,110 | $95,620 |
| 2022 | $4,453 | $142,730 | $47,110 | $95,620 |
| 2021 | $4,076 | $119,000 | $45,040 | $73,960 |
| 2020 | $4,076 | $119,000 | $45,040 | $73,960 |
| 2019 | $3,745 | $115,510 | $45,050 | $70,460 |
| 2018 | $3,748 | $115,510 | $45,050 | $70,460 |
| 2017 | $3,644 | $115,510 | $45,050 | $70,460 |
| 2016 | $3,567 | $113,060 | $45,040 | $68,020 |
| 2015 | $3,567 | $113,060 | $45,040 | $68,020 |
| 2014 | $3,497 | $109,100 | $45,050 | $64,050 |
Source: Public Records
Map
Nearby Homes
- 458 Thompson Ave
- 16 Vista Dr
- 26 Vista Dr
- 31 Forest St
- 48 Bishop St
- 385 Coe Ave Unit 1
- 366 Burr St
- 14 Gerrish Ave
- 375 Coe Ave Unit 22
- 1820 Dean St
- 4 Laura Ln
- 26 Nelson St
- 102 Vista Dr
- 140 Townsend Terrace
- 364 Main St Unit 47
- 19 Clark Ave
- 330 Short Beach Rd Unit C9
- 30 Silver Sands Rd Unit C-9
- 34 Beecher Place
- 77 Concord St