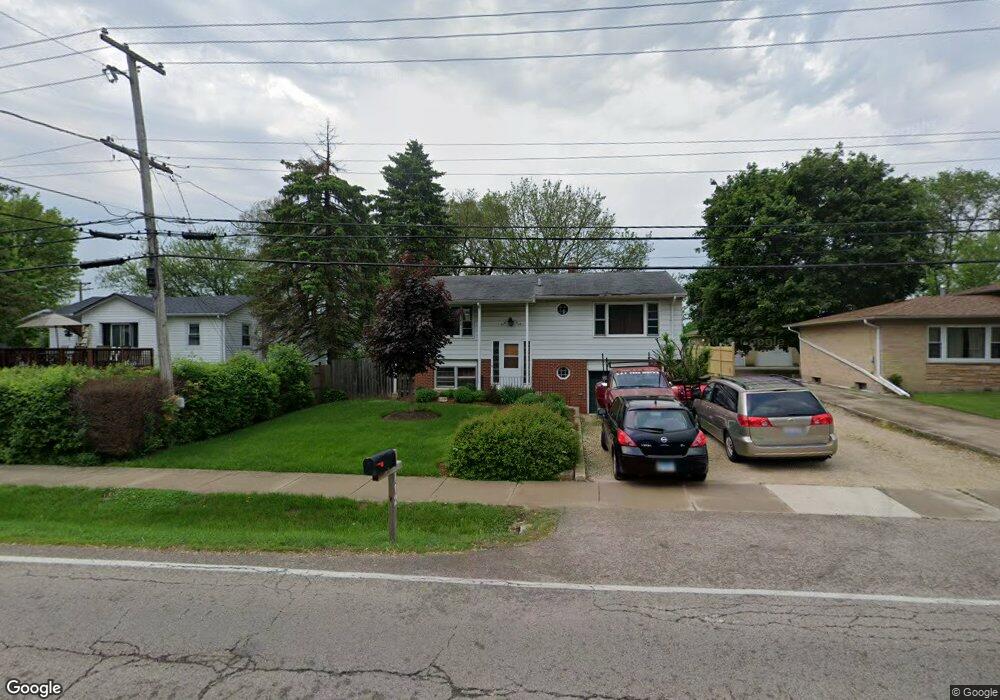
172 Kings Rd Carpentersville, IL 60110
Estimated Value: $286,000 - $336,000
3
Beds
2
Baths
1,700
Sq Ft
$177/Sq Ft
Est. Value
About This Home
This home is located at 172 Kings Rd, Carpentersville, IL 60110 and is currently estimated at $300,265, approximately $176 per square foot. 172 Kings Rd is a home located in Kane County with nearby schools including Perry Elementary School, Crescent City Grade School, and Carpentersville Middle School.
Ownership History
Date
Name
Owned For
Owner Type
Purchase Details
Closed on
May 25, 2018
Sold by
Garcia Samantha R and Hinojosa Samantha R
Bought by
Garcia Samantha R and Garcia Pastor
Current Estimated Value
Home Financials for this Owner
Home Financials are based on the most recent Mortgage that was taken out on this home.
Original Mortgage
$108,700
Outstanding Balance
$33,911
Interest Rate
4.5%
Mortgage Type
New Conventional
Estimated Equity
$266,354
Purchase Details
Closed on
Apr 27, 2012
Sold by
Lampasano Mary J
Bought by
Hinojosa Samantha R
Home Financials for this Owner
Home Financials are based on the most recent Mortgage that was taken out on this home.
Original Mortgage
$85,769
Interest Rate
3.87%
Mortgage Type
FHA
Create a Home Valuation Report for This Property
The Home Valuation Report is an in-depth analysis detailing your home's value as well as a comparison with similar homes in the area
Home Values in the Area
Average Home Value in this Area
Purchase History
| Date | Buyer | Sale Price | Title Company |
|---|---|---|---|
| Garcia Samantha R | -- | Title Source Inc | |
| Hinojosa Samantha R | $88,000 | Heritage Title Company |
Source: Public Records
Mortgage History
| Date | Status | Borrower | Loan Amount |
|---|---|---|---|
| Open | Garcia Samantha R | $108,700 | |
| Closed | Hinojosa Samantha R | $85,769 |
Source: Public Records
Tax History Compared to Growth
Tax History
| Year | Tax Paid | Tax Assessment Tax Assessment Total Assessment is a certain percentage of the fair market value that is determined by local assessors to be the total taxable value of land and additions on the property. | Land | Improvement |
|---|---|---|---|---|
| 2024 | $4,780 | $74,501 | $11,945 | $62,556 |
| 2023 | $4,440 | $67,034 | $10,748 | $56,286 |
| 2022 | $4,941 | $69,297 | $10,748 | $58,549 |
| 2021 | $4,781 | $65,430 | $10,148 | $55,282 |
| 2020 | $4,678 | $63,959 | $9,920 | $54,039 |
| 2019 | $4,533 | $60,717 | $9,417 | $51,300 |
| 2018 | $4,147 | $54,664 | $9,231 | $45,433 |
| 2017 | $3,802 | $49,424 | $8,635 | $40,789 |
| 2016 | $3,360 | $42,162 | $13,691 | $28,471 |
| 2015 | -- | $39,507 | $12,829 | $26,678 |
| 2014 | -- | $38,416 | $12,475 | $25,941 |
| 2013 | -- | $39,592 | $12,857 | $26,735 |
Source: Public Records
Map
Nearby Homes
- 171 Lake Shore Dr
- 105 Siesta Rd
- 200 Amarillo Dr
- 1426 Kings Rd
- 308 Amarillo Ct
- 181 Skyline Dr
- 149 Austin Ave
- 327 Tulsa Ave
- 140 Hickory Dr
- 7 Austin Ave
- 1431 Silverstone Dr Unit 1416
- 2013 Silverstone Dr Unit 2013
- 4 Austin Ave
- 494 Rosewood Dr
- 103 Hickory Dr
- 1040 Rosewood Dr
- 1317 Brookdale Dr
- 1309 Silverstone Dr Unit 1305
- 1303 Silverstone Dr Unit 1302
- 713 Silverstone Dr Unit 77
- 164 Kings Rd Unit 1
- 170 Kings Rd
- 168 Kings Rd
- 175 Kings Rd
- 163 Kings Rd
- 292 Skyline Dr
- 300 Deerpath Ln
- 293 Deerpath Ln
- 288 Skyline Dr
- 291 Deerpath Ln
- 146 Kings Rd
- 294 Deerpath Ln
- 292 Deerpath Ln Unit 1
- 290 Deerpath Ln
- 261 Deerpath Ln
- 89 Castlewood Dr
- 138 Kings Rd
- 263 Deerpath Ln
- 1553 Amarillo Dr
- 000 Kings Rd