172 Lime Sink Rd Whigham, GA 39897
Estimated Value: $236,558 - $321,000
3
Beds
1
Bath
1,623
Sq Ft
$172/Sq Ft
Est. Value
About This Home
This home is located at 172 Lime Sink Rd, Whigham, GA 39897 and is currently estimated at $279,640, approximately $172 per square foot. 172 Lime Sink Rd is a home located in Grady County.
Ownership History
Date
Name
Owned For
Owner Type
Purchase Details
Closed on
Mar 10, 2016
Sold by
Labounty Linda
Bought by
Whigham Mark
Current Estimated Value
Home Financials for this Owner
Home Financials are based on the most recent Mortgage that was taken out on this home.
Original Mortgage
$105,000
Outstanding Balance
$45,287
Interest Rate
3.65%
Mortgage Type
New Conventional
Estimated Equity
$234,353
Purchase Details
Closed on
Jan 28, 1999
Sold by
Hartley Donnie Cox
Bought by
Labounty Linda Ann Cox & 3 Others
Purchase Details
Closed on
Jul 27, 1976
Sold by
Cox Fred L Estate
Bought by
Donnie Cox
Purchase Details
Closed on
Apr 29, 1968
Sold by
Anderson Mrs Minna S
Bought by
Cox Donnie A and Fred Lafeyette
Create a Home Valuation Report for This Property
The Home Valuation Report is an in-depth analysis detailing your home's value as well as a comparison with similar homes in the area
Home Values in the Area
Average Home Value in this Area
Purchase History
| Date | Buyer | Sale Price | Title Company |
|---|---|---|---|
| Whigham Mark | $150,000 | -- | |
| Labounty Linda Ann Cox & 3 Others | -- | -- | |
| Donnie Cox | -- | -- | |
| Cox Donnie A | -- | -- |
Source: Public Records
Mortgage History
| Date | Status | Borrower | Loan Amount |
|---|---|---|---|
| Open | Whigham Mark | $105,000 |
Source: Public Records
Tax History Compared to Growth
Tax History
| Year | Tax Paid | Tax Assessment Tax Assessment Total Assessment is a certain percentage of the fair market value that is determined by local assessors to be the total taxable value of land and additions on the property. | Land | Improvement |
|---|---|---|---|---|
| 2024 | $1,865 | $79,068 | $32,132 | $46,936 |
| 2023 | $1,318 | $59,997 | $28,065 | $31,932 |
| 2022 | $1,311 | $59,997 | $28,065 | $31,932 |
| 2021 | $1,307 | $59,997 | $28,065 | $31,932 |
| 2020 | $1,305 | $59,997 | $28,065 | $31,932 |
| 2019 | $1,298 | $59,997 | $28,065 | $31,932 |
| 2018 | $1,145 | $59,775 | $27,843 | $31,932 |
| 2017 | $1,087 | $59,775 | $27,843 | $31,932 |
| 2016 | $957 | $55,093 | $27,843 | $27,250 |
| 2015 | $723 | $55,093 | $27,843 | $27,250 |
| 2014 | $718 | $55,093 | $27,843 | $27,250 |
| 2013 | -- | $49,279 | $24,567 | $24,712 |
Source: Public Records
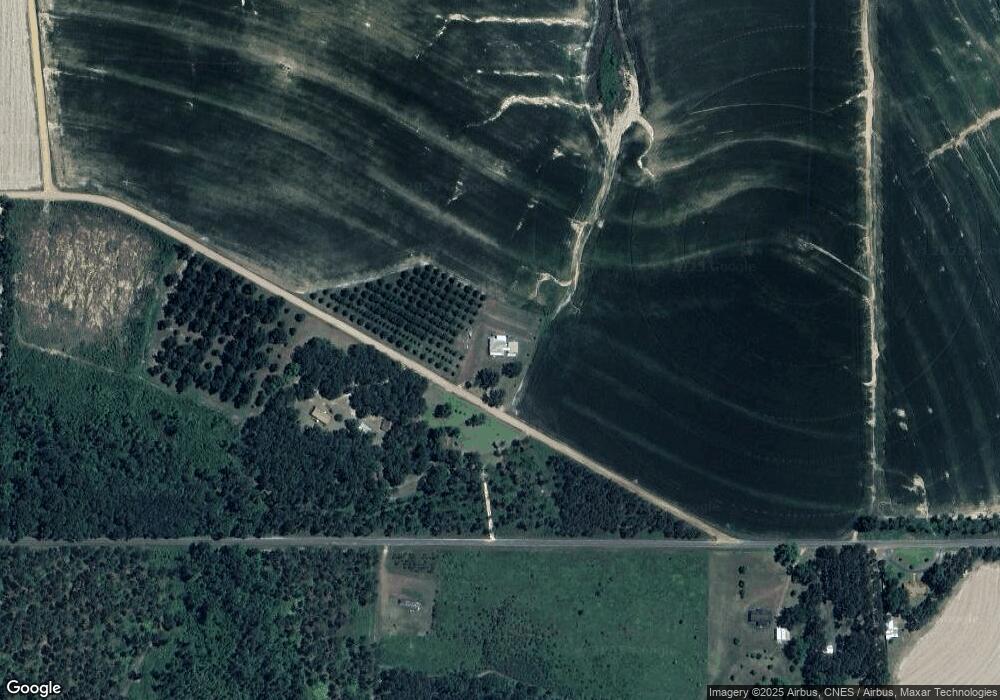
Map
Nearby Homes
- 1741 Georgia 112
- 53 +/- A Bond Rd
- 2033 Old 179 N
- 0 Harrell Rd
- 189 Sabino Dr
- 231 Mcintyre Ln
- 0 Cal Thomas Rd
- 1520 Upper Hawthorne Trail
- 264 Woodridge Ln
- 158 Woodridge Ln
- 0 Upper Hawthorne Trail
- 206 Lodge Ln
- 105 Woodridge Ln
- 1137 Summerfield
- 1725 Tract 2 Hwy 84w
- 1725 Tract #1 Hwy 84w
- Lot 1 Crine Blvd
- 165 Larkin St
- 1389 Lake Front Dr
- 1500 15th Ave NW