172 Main St Wakefield, MA 01880
Lakeside NeighborhoodEstimated Value: $1,393,000 - $1,534,000
5
Beds
5
Baths
3,400
Sq Ft
$429/Sq Ft
Est. Value
About This Home
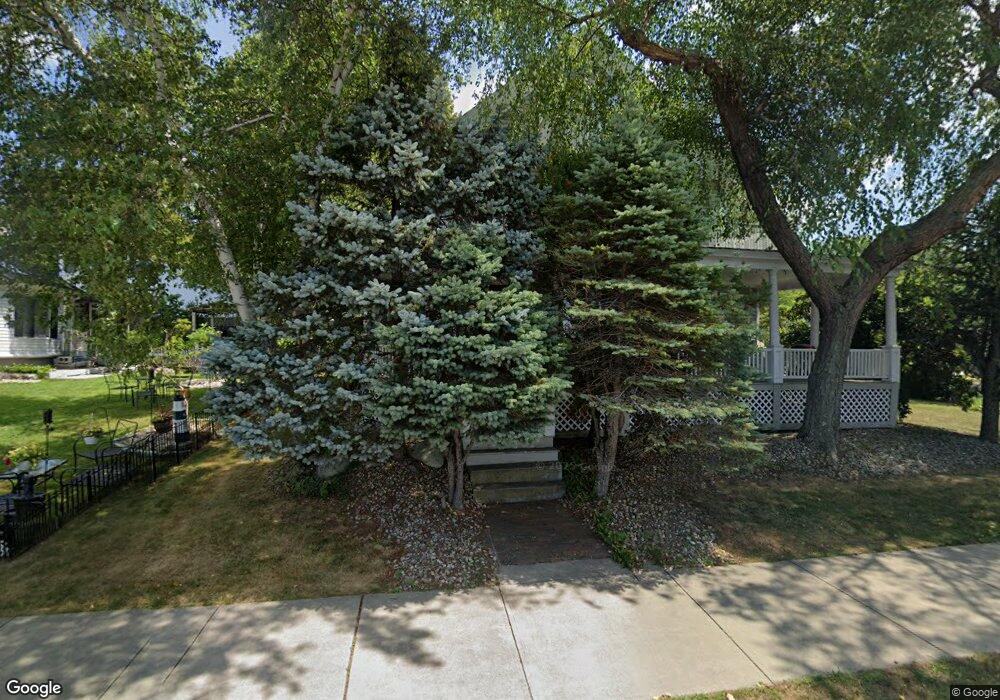
This home is located at 172 Main St, Wakefield, MA 01880 and is currently estimated at $1,457,568, approximately $428 per square foot. 172 Main St is a home located in Middlesex County with nearby schools including Wakefield Memorial High School, St Joseph School, and Odyssey Day School.
Ownership History
Date
Name
Owned For
Owner Type
Purchase Details
Closed on
Feb 10, 2021
Sold by
Crystal Lake Rt and Derocco
Bought by
Derocco Michael and Derocco Patrick A
Current Estimated Value
Purchase Details
Closed on
Mar 16, 2010
Sold by
Derocco Tr Michael and Derocco Patrick A
Bought by
Derocco Michael and Derocco Patrick A
Home Financials for this Owner
Home Financials are based on the most recent Mortgage that was taken out on this home.
Original Mortgage
$501,754
Interest Rate
5.02%
Mortgage Type
FHA
Purchase Details
Closed on
Oct 24, 2007
Sold by
Kenrick Albert N
Bought by
Crystal Lake Rt and Derocco
Create a Home Valuation Report for This Property
The Home Valuation Report is an in-depth analysis detailing your home's value as well as a comparison with similar homes in the area
Home Values in the Area
Average Home Value in this Area
Purchase History
| Date | Buyer | Sale Price | Title Company |
|---|---|---|---|
| Derocco Michael | -- | None Available | |
| Derocco Michael | -- | -- | |
| Derocco Michael | -- | -- | |
| Crystal Lake Rt | $681,000 | -- | |
| Crystal Lake Rt | $681,000 | -- |
Source: Public Records
Mortgage History
| Date | Status | Borrower | Loan Amount |
|---|---|---|---|
| Previous Owner | Derocco Michael | $501,754 | |
| Previous Owner | Crystal Lake Rt | $200,000 |
Source: Public Records
Tax History Compared to Growth
Tax History
| Year | Tax Paid | Tax Assessment Tax Assessment Total Assessment is a certain percentage of the fair market value that is determined by local assessors to be the total taxable value of land and additions on the property. | Land | Improvement |
|---|---|---|---|---|
| 2025 | $14,565 | $1,283,300 | $455,200 | $828,100 |
| 2024 | $13,753 | $1,222,500 | $433,500 | $789,000 |
| 2023 | $13,391 | $1,141,600 | $404,600 | $737,000 |
| 2022 | $12,570 | $1,020,300 | $361,300 | $659,000 |
| 2021 | $11,740 | $922,200 | $337,800 | $584,400 |
| 2020 | $11,082 | $867,800 | $317,900 | $549,900 |
| 2019 | $10,737 | $836,900 | $306,600 | $530,300 |
| 2018 | $10,338 | $798,300 | $292,400 | $505,900 |
| 2017 | $10,098 | $775,000 | $283,900 | $491,100 |
| 2016 | $9,656 | $715,800 | $263,200 | $452,600 |
| 2015 | $9,463 | $702,000 | $258,100 | $443,900 |
| 2014 | $8,972 | $702,000 | $258,100 | $443,900 |
Source: Public Records
Map
Nearby Homes