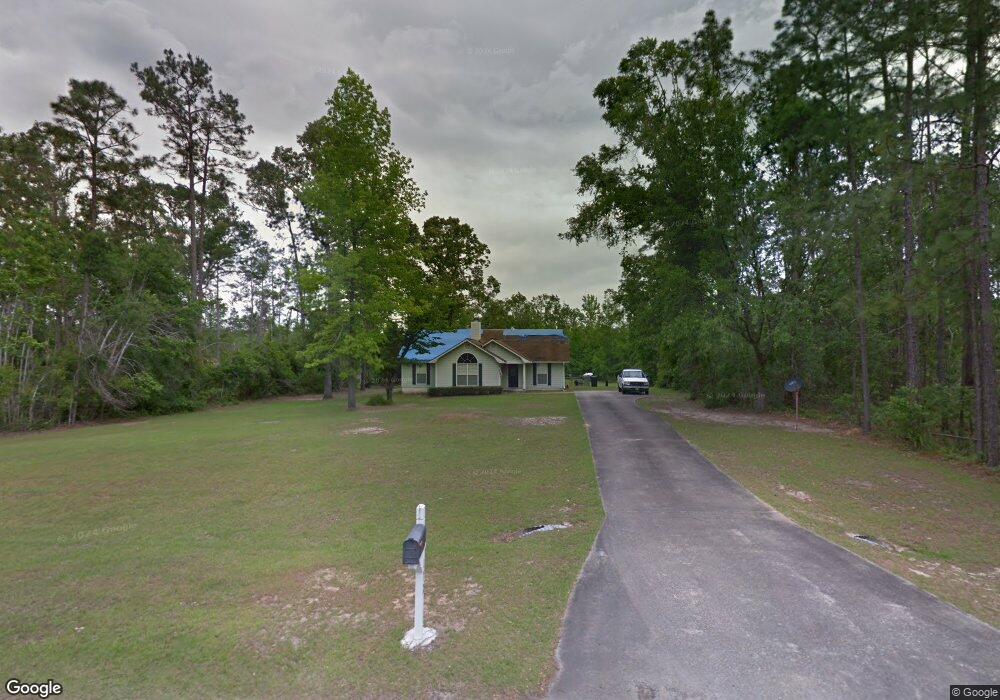
172 River Chase Dr Bainbridge, GA 39819
Estimated Value: $213,000 - $258,000
Studio
1
Bath
1,584
Sq Ft
$151/Sq Ft
Est. Value
About This Home
This home is located at 172 River Chase Dr, Bainbridge, GA 39819 and is currently estimated at $238,992, approximately $150 per square foot. 172 River Chase Dr is a home located in Decatur County with nearby schools including Bainbridge High School and Grace Christian Academy.
Ownership History
Date
Name
Owned For
Owner Type
Purchase Details
Closed on
Sep 6, 2011
Sold by
Secretary Of Housing & Urban Development
Bought by
Ward Stacy B
Current Estimated Value
Home Financials for this Owner
Home Financials are based on the most recent Mortgage that was taken out on this home.
Original Mortgage
$107,615
Outstanding Balance
$73,617
Interest Rate
4.62%
Mortgage Type
FHA
Estimated Equity
$165,375
Purchase Details
Closed on
Jan 4, 2011
Sold by
Suntrust Mortgage Inc
Bought by
Secretary Of Housing & Urban Development
Purchase Details
Closed on
Nov 18, 2005
Sold by
Scott Christopher L
Bought by
Day Glenda E
Home Financials for this Owner
Home Financials are based on the most recent Mortgage that was taken out on this home.
Original Mortgage
$120,000
Interest Rate
6.04%
Mortgage Type
New Conventional
Create a Home Valuation Report for This Property
The Home Valuation Report is an in-depth analysis detailing your home's value as well as a comparison with similar homes in the area
Purchase History
| Date | Buyer | Sale Price | Title Company |
|---|---|---|---|
| Ward Stacy B | -- | -- | |
| Secretary Of Housing & Urban Development | $193,555 | -- | |
| Suntrust Mortgage Inc | $193,555 | -- | |
| Day Glenda E | $150,000 | -- |
Source: Public Records
Mortgage History
| Date | Status | Borrower | Loan Amount |
|---|---|---|---|
| Open | Ward Stacy B | $107,615 | |
| Previous Owner | Day Glenda E | $120,000 | |
| Previous Owner | Day Glenda E | $30,000 |
Source: Public Records
Tax History
| Year | Tax Paid | Tax Assessment Tax Assessment Total Assessment is a certain percentage of the fair market value that is determined by local assessors to be the total taxable value of land and additions on the property. | Land | Improvement |
|---|---|---|---|---|
| 2025 | $2,159 | $81,780 | $12,000 | $69,780 |
| 2024 | $2,169 | $74,033 | $12,000 | $62,033 |
| 2023 | $1,746 | $74,033 | $12,000 | $62,033 |
| 2022 | $2,096 | $74,033 | $12,000 | $62,033 |
| 2021 | $1,868 | $65,002 | $12,000 | $53,002 |
| 2020 | $1,698 | $56,366 | $12,000 | $44,366 |
| 2019 | $1,580 | $50,720 | $12,000 | $38,720 |
| 2018 | $1,754 | $56,749 | $12,000 | $44,749 |
| 2017 | $1,781 | $56,749 | $12,000 | $44,749 |
| 2016 | $1,718 | $56,749 | $12,000 | $44,749 |
| 2015 | $1,742 | $56,749 | $12,000 | $44,749 |
| 2014 | $1,519 | $56,749 | $12,000 | $44,749 |
| 2013 | -- | $56,749 | $12,000 | $44,749 |
Source: Public Records
Map
Nearby Homes
- 177 Riverchase Dr
- Lot 13 A Mountain View Way Unit 13 A
- Lot 12 A Mountain View Way Unit 12
- 0 Faceville Hwy
- 145 Robin Ln
- 100 Robin Ln
- 1000 Faceville Hwy
- 299 Country Club Rd
- 909 Cox Ave
- 850 Avenue C
- 820 Avenue C
- TBD LOTS 1, 2 Seminole Ridge S D
- 0 Georgia 97 Unit TRACT A
- TBD LOT 99 & 10 Seminole Ridge S D
- 211 Edgewood Dr
- 226 Edgewood Dr
- 2400 Airport Rd Unit 6
- 1325 Faceville Hwy
- 1514 Fairway Dr
- 212 Michaels Way
- 172 Riverchase Dr
- 178 River Chase Dr
- 162 River Chase Dr
- Lot C4 S Riverchase Dr
- Lot 2 Riverchase Dr
- Lot B4 N Riverchase Dr
- 184 River Chase Dr
- Lot C5S Riverchase Dr
- 177 River Chase Dr
- 171 River Chase Dr
- 165 River Chase Dr
- 183 River Chase Dr
- 183 Riverchase Dr
- 159 River Chase Dr
- 190 River Chase Dr
- 189 River Chase Dr
- 155 River Chase Dr
- 191 River Chase Dr
- 151 River Chase Dr
- 146 River Chase Dr
Your Personal Tour Guide
Ask me questions while you tour the home.