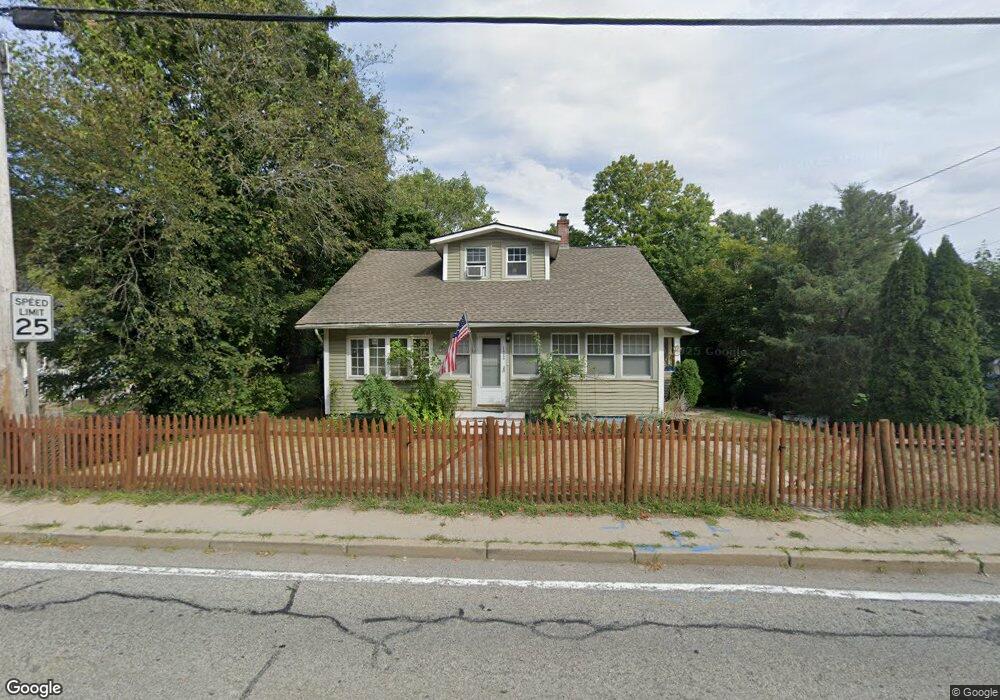
172 S Main St Coventry, RI 02816
Estimated Value: $249,000 - $405,000
3
Beds
1
Bath
1,276
Sq Ft
$269/Sq Ft
Est. Value
About This Home
This home is located at 172 S Main St, Coventry, RI 02816 and is currently estimated at $343,875, approximately $269 per square foot. 172 S Main St is a home located in Kent County with nearby schools including Alan Shawn Feinstein Ms Of Cov, Coventry High School, and Father John V. Doyle School.
Ownership History
Date
Name
Owned For
Owner Type
Purchase Details
Closed on
Feb 27, 2009
Sold by
Fnma
Bought by
Lombard David A and Lombard Diane E
Current Estimated Value
Home Financials for this Owner
Home Financials are based on the most recent Mortgage that was taken out on this home.
Original Mortgage
$215,000
Outstanding Balance
$99,446
Interest Rate
5%
Mortgage Type
Purchase Money Mortgage
Estimated Equity
$244,429
Purchase Details
Closed on
Dec 18, 2008
Sold by
Thayer Annmarie D
Bought by
Federal National Mortgage Association
Purchase Details
Closed on
Aug 24, 1994
Sold by
Hoover Lillian M
Bought by
Bellisle Bellisle J and Bellisle Cynthia
Create a Home Valuation Report for This Property
The Home Valuation Report is an in-depth analysis detailing your home's value as well as a comparison with similar homes in the area
Purchase History
| Date | Buyer | Sale Price | Title Company |
|---|---|---|---|
| Lombard David A | $140,000 | -- | |
| Federal National Mortgage Association | $325,587 | -- | |
| Bellisle Bellisle J | $93,000 | -- |
Source: Public Records
Mortgage History
| Date | Status | Borrower | Loan Amount |
|---|---|---|---|
| Open | Bellisle Bellisle J | $124,000 | |
| Open | Bellisle Bellisle J | $215,000 |
Source: Public Records
Tax History
| Year | Tax Paid | Tax Assessment Tax Assessment Total Assessment is a certain percentage of the fair market value that is determined by local assessors to be the total taxable value of land and additions on the property. | Land | Improvement |
|---|---|---|---|---|
| 2025 | $3,374 | $209,700 | $85,100 | $124,600 |
| 2024 | $3,322 | $209,700 | $85,100 | $124,600 |
| 2023 | $3,215 | $209,700 | $85,100 | $124,600 |
| 2022 | $3,836 | $196,000 | $79,000 | $117,000 |
| 2021 | $3,802 | $196,000 | $79,000 | $117,000 |
| 2020 | $4,359 | $196,000 | $79,000 | $117,000 |
| 2019 | $3,861 | $173,600 | $67,000 | $106,600 |
| 2018 | $3,751 | $173,600 | $67,000 | $106,600 |
| 2017 | $3,642 | $173,600 | $67,000 | $106,600 |
| 2016 | $3,565 | $166,500 | $54,600 | $111,900 |
| 2015 | $3,468 | $166,500 | $54,600 | $111,900 |
| 2014 | $3,396 | $166,500 | $54,600 | $111,900 |
| 2013 | $3,620 | $194,000 | $92,400 | $101,600 |
Source: Public Records
Map
Nearby Homes
- 184 S Main St
- 164 S Main St
- 118 Rathbun St
- 22 Rathbun St (Anthony) St
- 165 S Main St
- 7 Lambert St
- 1 Lambert St
- 113 Rathbun St
- 109 Rathbun St
- 156 S Main St
- 181 S Main St
- 177 S Main St
- 6 Lambert St
- 105 Rathbun St
- 117 Rathbun St
- 130 Rathbun St
- 188 S Main St
- 149 S Main St
- 20 Woodland Ave
- 148 S Main St Unit 150
Your Personal Tour Guide
Ask me questions while you tour the home.