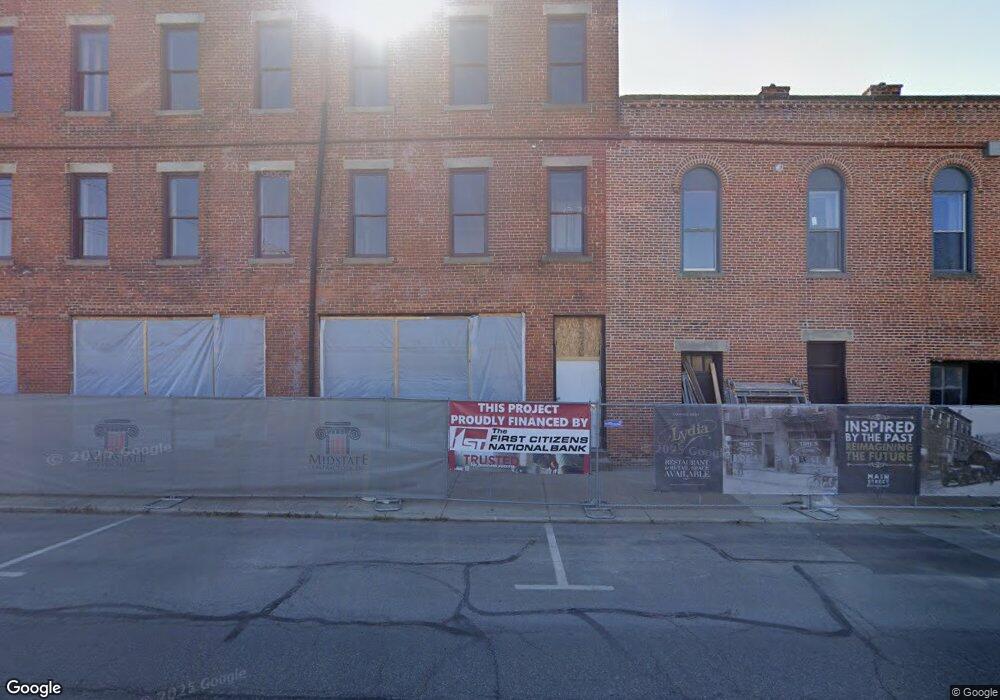
172 S Main St Marion, OH 43302
Estimated Value: $128,760
--
Bed
--
Bath
12,000
Sq Ft
$11/Sq Ft
Est. Value
About This Home
This home is located at 172 S Main St, Marion, OH 43302 and is currently estimated at $128,760, approximately $10 per square foot. 172 S Main St is a home located in Marion County with nearby schools including Benjamin Harrison Elementary School, Ulysses S. Grant Middle School, and Harding High School.
Ownership History
Date
Name
Owned For
Owner Type
Purchase Details
Closed on
Jul 1, 2020
Sold by
Main Street Reimagined Llc
Bought by
Main Street Reimagined Ii Llc
Current Estimated Value
Purchase Details
Closed on
Nov 1, 2018
Sold by
Marion Historical Llc
Bought by
Main Street Reimagined Llc
Purchase Details
Closed on
Feb 12, 2016
Sold by
Childrens Development Llc
Bought by
Marion Historical Llc
Purchase Details
Closed on
Aug 26, 2015
Sold by
The Union Bank Company
Bought by
Childrens Development Llc
Purchase Details
Closed on
Mar 30, 2015
Sold by
Ziemnik Raymond J
Bought by
The Union Bank Company
Purchase Details
Closed on
Mar 12, 2003
Bought by
Marion Historical Llc
Purchase Details
Closed on
Oct 31, 2002
Bought by
Marion Historical Llc
Purchase Details
Closed on
Apr 11, 1997
Bought by
Marion Historical Llc
Purchase Details
Closed on
Jun 21, 1995
Bought by
Marion Historical Llc
Create a Home Valuation Report for This Property
The Home Valuation Report is an in-depth analysis detailing your home's value as well as a comparison with similar homes in the area
Home Values in the Area
Average Home Value in this Area
Purchase History
| Date | Buyer | Sale Price | Title Company |
|---|---|---|---|
| Main Street Reimagined Ii Llc | -- | None Available | |
| Main Street Reimagined Llc | $75,000 | None Available | |
| Marion Historical Llc | -- | Attorney | |
| Childrens Development Llc | $12,000 | Attorney | |
| The Union Bank Company | $50,000 | Attorney | |
| Marion Historical Llc | $123,700 | -- | |
| Marion Historical Llc | $100,000 | -- | |
| Marion Historical Llc | -- | -- | |
| Marion Historical Llc | -- | -- |
Source: Public Records
Tax History Compared to Growth
Tax History
| Year | Tax Paid | Tax Assessment Tax Assessment Total Assessment is a certain percentage of the fair market value that is determined by local assessors to be the total taxable value of land and additions on the property. | Land | Improvement |
|---|---|---|---|---|
| 2024 | $873 | $18,820 | $4,910 | $13,910 |
| 2023 | $873 | $18,820 | $4,910 | $13,910 |
| 2022 | $826 | $18,820 | $4,910 | $13,910 |
| 2021 | $878 | $18,820 | $4,910 | $13,910 |
| 2020 | $909 | $18,820 | $4,910 | $13,910 |
| 2019 | $1,055 | $18,820 | $4,910 | $13,910 |
| 2018 | $2,094 | $35,510 | $4,910 | $30,600 |
| 2017 | $1,700 | $35,510 | $4,910 | $30,600 |
| 2016 | $1,686 | $35,510 | $4,910 | $30,600 |
| 2015 | $1,704 | $35,510 | $4,910 | $30,600 |
| 2014 | $1,917 | $35,510 | $4,910 | $30,600 |
| 2012 | $1,843 | $37,910 | $4,310 | $33,600 |
Source: Public Records
Map
Nearby Homes
- 254 S State St
- 367 S Main St
- 198 Windsor St
- 341 Girard Ave
- 325 Holmes Place
- 239 Gurley Ave
- 266 Oak St
- 374 Nunin Ct
- 482 Courtland Terrace
- 302 Blaine Ave
- 236 Silver St
- 375 N Main St
- 339 Belmont St
- 178 Leader St
- 347 Mary St
- 429 W Columbia St
- 395 N Main St
- 314 E Washington Ave
- 343 Commercial St
- 127 E Walnut St
- 158 S Main St
- 196 S Main St
- 119 W Church St
- 181 S Main St
- 150 S Main St
- 149 E Church St
- 123 W Church St
- 151 S Main St
- 153 Main Stsouth
- 153 S Main St
- 151 Main Stsouth
- 127 W Church St
- 130 S Main St Unit 2
- 130 S Main St
- 126 S Main St Unit abcd
- 126 S Main St
- 135 S Main St
- 135 S State St
- 122 S Main St
- 127 S Main St