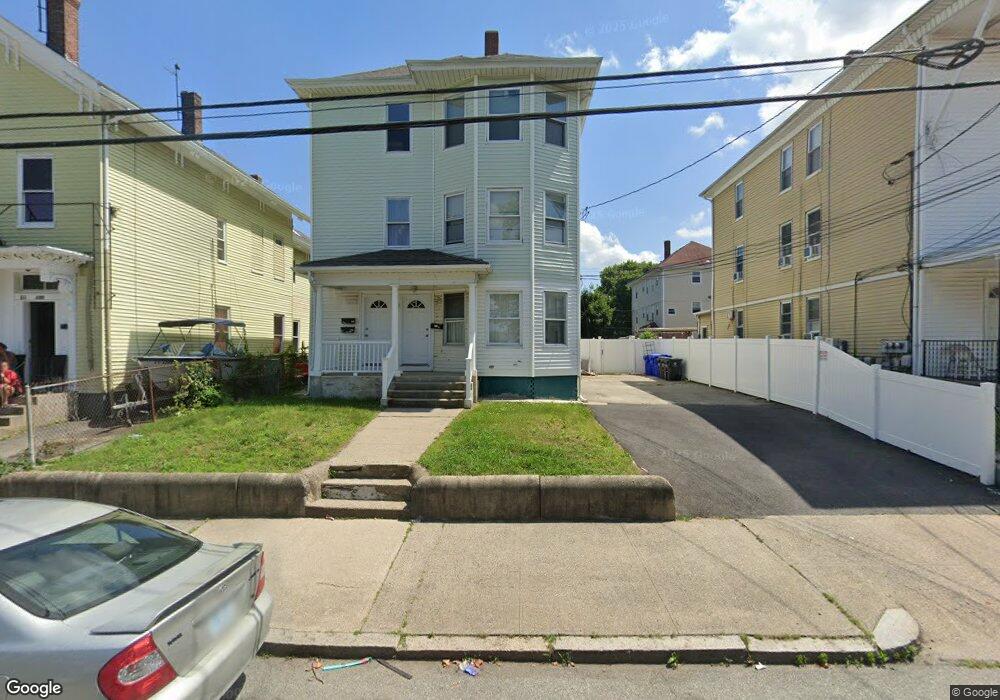
172 Sisson St Pawtucket, RI 02860
Woodlawn NeighborhoodEstimated Value: $541,268 - $657,000
9
Beds
3
Baths
3,381
Sq Ft
$180/Sq Ft
Est. Value
About This Home
This home is located at 172 Sisson St, Pawtucket, RI 02860 and is currently estimated at $609,567, approximately $180 per square foot. 172 Sisson St is a home located in Providence County with nearby schools including International Charter School, Blackstone Valley Prep Junior High School, and Blackstone Academy Charter School.
Ownership History
Date
Name
Owned For
Owner Type
Purchase Details
Closed on
Feb 6, 2018
Sold by
Julio M Cardoso
Bought by
Lopes Adelsandra
Current Estimated Value
Home Financials for this Owner
Home Financials are based on the most recent Mortgage that was taken out on this home.
Original Mortgage
$225,834
Outstanding Balance
$191,491
Interest Rate
4.22%
Estimated Equity
$418,076
Purchase Details
Closed on
Mar 31, 2014
Sold by
Cardoso Alice
Bought by
Cardoso Julio M
Purchase Details
Closed on
Aug 28, 2007
Sold by
Docouto Titolivio R
Bought by
Cardoso Julio M and Cardoso Alice
Create a Home Valuation Report for This Property
The Home Valuation Report is an in-depth analysis detailing your home's value as well as a comparison with similar homes in the area
Home Values in the Area
Average Home Value in this Area
Purchase History
| Date | Buyer | Sale Price | Title Company |
|---|---|---|---|
| Lopes Adelsandra | -- | -- | |
| Cardoso Julio M | -- | -- | |
| Cardoso Julio M | $300,000 | -- |
Source: Public Records
Mortgage History
| Date | Status | Borrower | Loan Amount |
|---|---|---|---|
| Open | Cardoso Julio M | $225,834 | |
| Closed | Cardoso Julio M | -- | |
| Previous Owner | Cardoso Julio M | $453,918 | |
| Previous Owner | Cardoso Julio M | $243,750 |
Source: Public Records
Tax History Compared to Growth
Tax History
| Year | Tax Paid | Tax Assessment Tax Assessment Total Assessment is a certain percentage of the fair market value that is determined by local assessors to be the total taxable value of land and additions on the property. | Land | Improvement |
|---|---|---|---|---|
| 2025 | $6,257 | $475,800 | $116,900 | $358,900 |
| 2024 | $5,871 | $475,800 | $116,900 | $358,900 |
| 2023 | $5,284 | $311,900 | $52,600 | $259,300 |
| 2022 | $5,171 | $311,900 | $52,600 | $259,300 |
| 2021 | $5,171 | $311,900 | $52,600 | $259,300 |
| 2020 | $4,295 | $205,600 | $53,300 | $152,300 |
| 2019 | $4,295 | $205,600 | $53,300 | $152,300 |
| 2018 | $4,139 | $205,600 | $53,300 | $152,300 |
| 2017 | $4,246 | $186,900 | $40,100 | $146,800 |
| 2016 | $4,091 | $186,900 | $40,100 | $146,800 |
| 2015 | $4,091 | $186,900 | $40,100 | $146,800 |
| 2014 | $3,484 | $151,100 | $51,500 | $99,600 |
Source: Public Records
Map
Nearby Homes