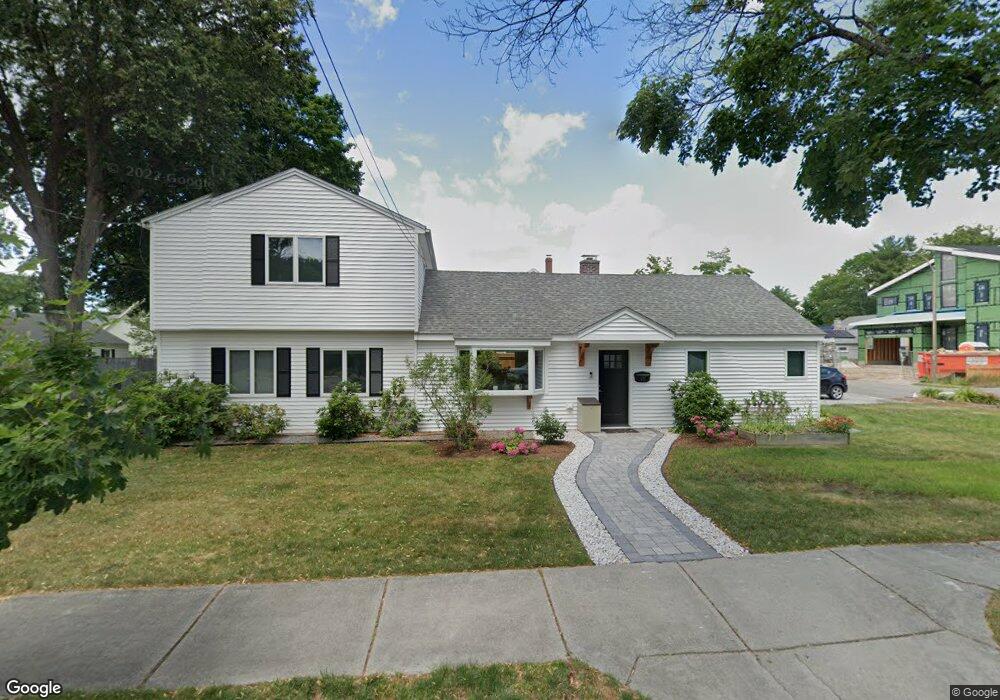
172 Spiers Rd Newton Center, MA 02459
Mount Ida NeighborhoodEstimated Value: $1,094,034 - $1,489,000
3
Beds
3
Baths
1,844
Sq Ft
$654/Sq Ft
Est. Value
About This Home
This home is located at 172 Spiers Rd, Newton Center, MA 02459 and is currently estimated at $1,205,759, approximately $653 per square foot. 172 Spiers Rd is a home located in Middlesex County with nearby schools including Memorial Spaulding Elementary School, Oak Hill Middle School, and Newton South High School.
Ownership History
Date
Name
Owned For
Owner Type
Purchase Details
Closed on
Feb 22, 2013
Sold by
Skolnick Joel and Skolnick Avital
Bought by
Vital Joel and Vital Skolnick R
Current Estimated Value
Home Financials for this Owner
Home Financials are based on the most recent Mortgage that was taken out on this home.
Original Mortgage
$184,000
Outstanding Balance
$35,037
Interest Rate
3.36%
Estimated Equity
$1,170,722
Purchase Details
Closed on
Aug 17, 1990
Sold by
Sidney Est Klickstein
Bought by
Skolnick Joel
Create a Home Valuation Report for This Property
The Home Valuation Report is an in-depth analysis detailing your home's value as well as a comparison with similar homes in the area
Home Values in the Area
Average Home Value in this Area
Purchase History
| Date | Buyer | Sale Price | Title Company |
|---|---|---|---|
| Vital Joel | -- | -- | |
| Skolnick Joel | $158,500 | -- |
Source: Public Records
Mortgage History
| Date | Status | Borrower | Loan Amount |
|---|---|---|---|
| Open | Skolnick Joel | $184,000 | |
| Closed | Skolnick Joel | $191,800 |
Source: Public Records
Tax History Compared to Growth
Tax History
| Year | Tax Paid | Tax Assessment Tax Assessment Total Assessment is a certain percentage of the fair market value that is determined by local assessors to be the total taxable value of land and additions on the property. | Land | Improvement |
|---|---|---|---|---|
| 2025 | $7,159 | $730,500 | $608,700 | $121,800 |
| 2024 | $6,922 | $709,200 | $591,000 | $118,200 |
| 2023 | $6,381 | $626,800 | $444,200 | $182,600 |
| 2022 | $5,554 | $527,900 | $411,300 | $116,600 |
| 2021 | $7,047 | $498,000 | $388,000 | $110,000 |
| 2020 | $5,199 | $498,000 | $388,000 | $110,000 |
| 2019 | $6,405 | $483,500 | $376,700 | $106,800 |
| 2018 | $5,852 | $440,600 | $341,600 | $99,000 |
| 2017 | $4,623 | $415,700 | $322,300 | $93,400 |
| 2016 | $4,421 | $388,500 | $301,200 | $87,300 |
| 2015 | $4,216 | $363,100 | $281,500 | $81,600 |
Source: Public Records
Map
Nearby Homes
- 141 Spiers Rd
- 544 Saw Mill Brook Pkwy
- 30 Esty Farm Rd
- 22 Nightingale Path
- 30 K Roadway
- 579 Baker St Unit 579
- 577 Baker St Unit 577
- 931 Lagrange St
- 845 Lagrange St Unit 4
- 36 Ober Rd
- 21 Lovett Rd
- 1206 Lagrange St Unit 1206
- 44 Lovett Rd
- 331 Vermont St
- 17 Tirrell Crescent
- 210 Nahanton St Unit 404
- 89 Dwinell St
- 207 Nahanton St Unit 207
- 135 Hartman Rd
- 63 Drumlin Rd