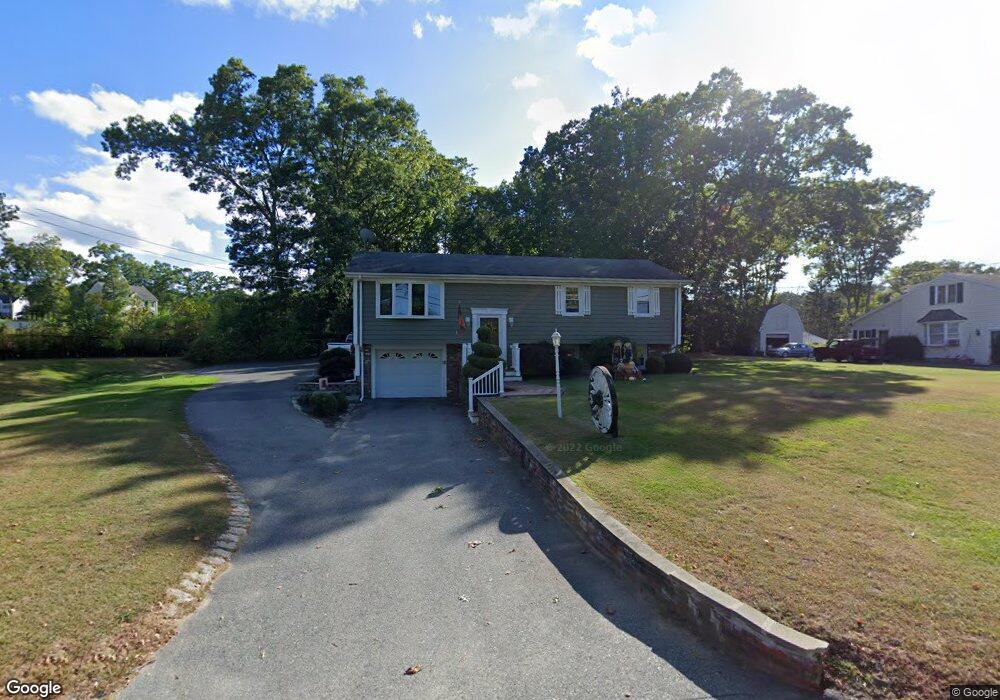
172 Tickle Rd Westport, MA 02790
North Westport NeighborhoodEstimated Value: $430,000 - $514,000
3
Beds
--
Bath
1,100
Sq Ft
$432/Sq Ft
Est. Value
About This Home
This home is located at 172 Tickle Rd, Westport, MA 02790 and is currently estimated at $475,109, approximately $431 per square foot. 172 Tickle Rd is a home located in Bristol County with nearby schools including Alice A. Macomber Primary School, Westport Elementary School, and Westport Middle-High School.
Ownership History
Date
Name
Owned For
Owner Type
Purchase Details
Closed on
Feb 3, 1998
Sold by
Routhier Robert R and Warner Jeanne Y
Bought by
Warner Jeanne Y and Warner Timothy B
Current Estimated Value
Home Financials for this Owner
Home Financials are based on the most recent Mortgage that was taken out on this home.
Original Mortgage
$65,000
Interest Rate
7.02%
Mortgage Type
Purchase Money Mortgage
Create a Home Valuation Report for This Property
The Home Valuation Report is an in-depth analysis detailing your home's value as well as a comparison with similar homes in the area
Home Values in the Area
Average Home Value in this Area
Purchase History
| Date | Buyer | Sale Price | Title Company |
|---|---|---|---|
| Warner Jeanne Y | $65,000 | -- |
Source: Public Records
Mortgage History
| Date | Status | Borrower | Loan Amount |
|---|---|---|---|
| Open | Warner Jeanne Y | $125,000 | |
| Closed | Warner Jeanne Y | $75,000 | |
| Closed | Warner Jeanne Y | $63,500 | |
| Closed | Warner Jeanne Y | $65,000 |
Source: Public Records
Tax History Compared to Growth
Tax History
| Year | Tax Paid | Tax Assessment Tax Assessment Total Assessment is a certain percentage of the fair market value that is determined by local assessors to be the total taxable value of land and additions on the property. | Land | Improvement |
|---|---|---|---|---|
| 2025 | $2,878 | $386,300 | $175,900 | $210,400 |
| 2024 | $2,866 | $370,700 | $162,900 | $207,800 |
| 2023 | $2,657 | $325,600 | $142,800 | $182,800 |
| 2022 | $2,656 | $313,200 | $142,800 | $170,400 |
| 2021 | $2,555 | $296,400 | $129,800 | $166,600 |
| 2020 | $2,455 | $291,200 | $124,600 | $166,600 |
| 2019 | $2,206 | $266,700 | $108,400 | $158,300 |
| 2018 | $2,183 | $267,200 | $116,600 | $150,600 |
| 2017 | $2,059 | $258,400 | $116,600 | $141,800 |
| 2016 | $1,973 | $249,400 | $116,600 | $132,800 |
| 2015 | $2,010 | $253,500 | $116,600 | $136,900 |
Source: Public Records
Map
Nearby Homes
- 51 Newton St
- 0 Tickle Rd Unit 73453134
- 219 Tickle Rd
- 100 Cory's Ln
- 47 Devol Ave
- 33 Moniz Dr
- 100 Corys Ln
- 40 Robert St
- 75 Montgomery St
- 218 American Legion Hwy
- 771 Sanford Rd
- 14 Glendale Ave
- 71 Blackbird St
- 1125 Stafford Rd Unit 5
- 8 Campion Ave
- 92 Benoit St
- 9 Blackbird St
- 37 Bluejay St
- 84 Lark Ln
- 4 Lake Ave
- 6 Newton St
- 185 Tickle Rd
- 12 Newton St
- 179 Tickle Rd
- 196 Tickle Rd
- 189 Tickle Rd
- 3 Devol Ave
- 274 Tickle Rd
- Lot 1 Tickle Rd
- 0 Courtney Dr Unit 761349
- 0 Courtney Dr Unit 759952
- 0 Courtney Dr Unit 759956
- 0 Courtney Dr Unit 759941
- 0 Courtney Dr Unit 661773
- 0 Courtney Dr Unit 70692742
- 0 Courtney Dr
- 1 Devol Ave
- 18 Newton St
- 3 Newton St
- 175 Tickle Rd