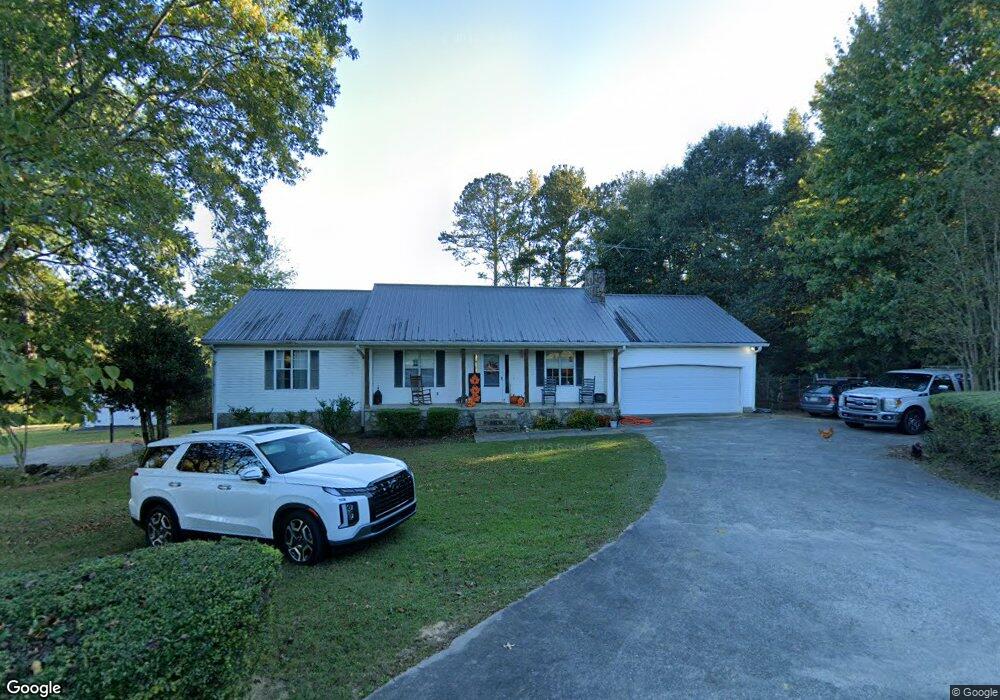
172 Turvey Nichols Rd Cisco, GA 30708
Cisco NeighborhoodEstimated Value: $87,218 - $341,000
--
Bed
2
Baths
1,738
Sq Ft
$118/Sq Ft
Est. Value
About This Home
This home is located at 172 Turvey Nichols Rd, Cisco, GA 30708 and is currently estimated at $204,555, approximately $117 per square foot. 172 Turvey Nichols Rd is a home located in Murray County with nearby schools including Northwest Elementary School, Bagley Middle School, and North Murray High School.
Ownership History
Date
Name
Owned For
Owner Type
Purchase Details
Closed on
Sep 29, 2021
Sold by
Sanford Morgan Griffin
Bought by
Wyse Marcus H and Wyse Sabrina L
Current Estimated Value
Home Financials for this Owner
Home Financials are based on the most recent Mortgage that was taken out on this home.
Original Mortgage
$245,471
Outstanding Balance
$223,847
Interest Rate
2.8%
Mortgage Type
FHA
Estimated Equity
-$19,292
Purchase Details
Closed on
Jan 24, 2019
Sold by
Cochran Lynn Higdon
Bought by
Griffin Sanford Morgan and Chase Sanford Bradley
Purchase Details
Closed on
Dec 23, 2018
Sold by
Baxter Marjorie
Bought by
Baxter Marjorie and Cochran Lynn
Purchase Details
Closed on
Mar 14, 2014
Sold by
Bonds Juliette Burnett
Bought by
Cochran Lynn Higdon
Purchase Details
Closed on
Jul 27, 2011
Sold by
Dobos Shirley
Bought by
Baxter Marjorie
Purchase Details
Closed on
Jul 21, 2011
Sold by
Dobos Shirley
Bought by
Baxter Marjorie
Purchase Details
Closed on
Apr 4, 1995
Bought by
Dobas Shirley
Create a Home Valuation Report for This Property
The Home Valuation Report is an in-depth analysis detailing your home's value as well as a comparison with similar homes in the area
Home Values in the Area
Average Home Value in this Area
Purchase History
| Date | Buyer | Sale Price | Title Company |
|---|---|---|---|
| Wyse Marcus H | $250,000 | -- | |
| Griffin Sanford Morgan | -- | -- | |
| Baxter Marjorie | -- | -- | |
| Cochran Lynn Higdon | -- | -- | |
| Baxter Marjorie | -- | -- | |
| Baxter Marjorie | -- | -- | |
| Dobas Shirley | -- | -- |
Source: Public Records
Mortgage History
| Date | Status | Borrower | Loan Amount |
|---|---|---|---|
| Open | Wyse Marcus H | $245,471 |
Source: Public Records
Tax History Compared to Growth
Tax History
| Year | Tax Paid | Tax Assessment Tax Assessment Total Assessment is a certain percentage of the fair market value that is determined by local assessors to be the total taxable value of land and additions on the property. | Land | Improvement |
|---|---|---|---|---|
| 2024 | $97 | $4,120 | $3,240 | $880 |
| 2023 | $97 | $4,040 | $3,240 | $800 |
| 2022 | $93 | $3,880 | $3,080 | $800 |
| 2021 | $1,929 | $78,400 | $5,720 | $72,680 |
| 2020 | $1,714 | $69,680 | $5,480 | $64,200 |
| 2019 | $1,648 | $66,720 | $5,480 | $61,240 |
| 2018 | $488 | $65,120 | $3,880 | $61,240 |
| 2017 | $0 | $59,080 | $3,880 | $55,200 |
| 2016 | $304 | $54,320 | $7,120 | $47,200 |
| 2015 | -- | $54,320 | $7,120 | $47,200 |
| 2014 | -- | $54,320 | $7,120 | $47,200 |
| 2013 | -- | $54,320 | $7,120 | $47,200 |
Source: Public Records
Map
Nearby Homes
- 1141 Brush Town Rd
- 44 Brush Town Rd
- 910 Brushtown Rd
- 396 Doctor Johnson Rd
- 1339 Richard Bennett Rd
- 0 Doctor Johnson Rd
- 19 Highway 411
- Landlot 19 Highway 411
- 10104 Georgia 225 Unit 4
- 1639 Tennga Gregory Rd
- 9338 Hwy 255n
- 1371 Halls Chapel Rd
- 000 Liberty Church Rd
- 160 Fairy Valley Dr
- 247 Ac Maddron Rd
- 00 Halls Chapel Rd
- 242 AC Maddron Rd
- 205+ Ac Maddron Rd
- 00 Georgia 2
- 0 Baxter Rd
- 132 Turvey Nichols Rd
- 180 Turvey Nichols Rd
- 204 Turvey Nichols Rd
- 236 Turvey Nichols Rd
- 12281 Highway 411 N
- 240 Turvey Nichols Rd
- 282 Turvey Nichols Rd
- 12085 U S 411
- 314 Turvey Nichols Rd
- 12149 Highway 411 N
- 314 Turvey Nichols Rd
- 12085 Highway 411 N
- 12146 Highway 411 N
- 129 Higdon Rd
- 334 Turvey Nichols Rd
- 369 Turvey Nichols Rd
- 85 Higdon Rd
- 0 N Hwy 411 Unit 1152696
- 12330 Highway 411
- 12258 Highway 411 N