172 Tyler Ln Carrollton, GA 30117
Estimated Value: $244,000 - $264,563
3
Beds
2
Baths
1,419
Sq Ft
$179/Sq Ft
Est. Value
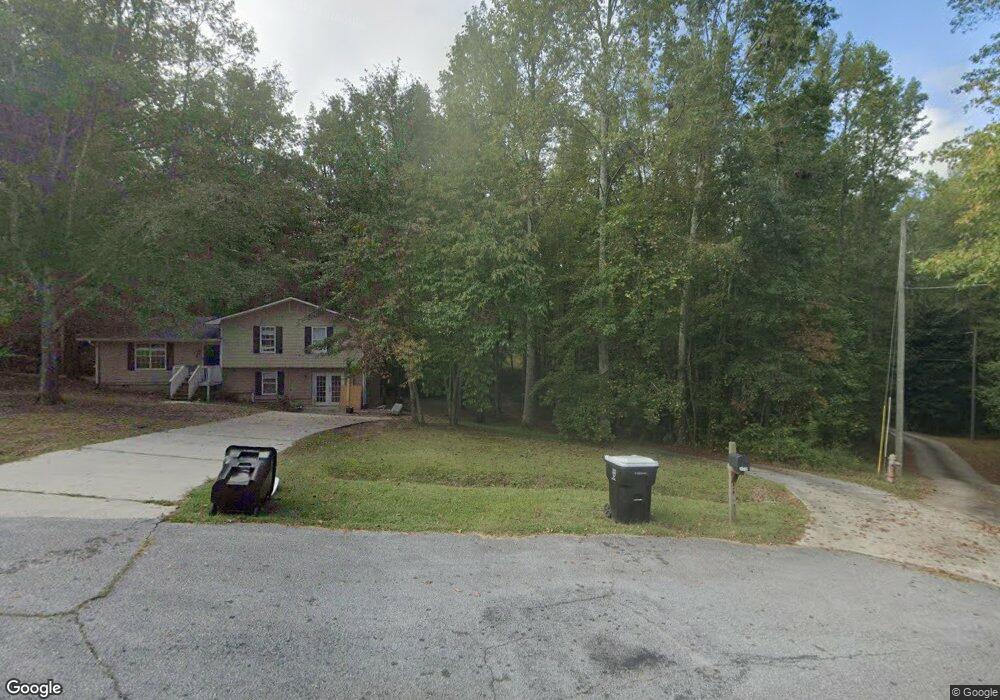
About This Home
This home is located at 172 Tyler Ln, Carrollton, GA 30117 and is currently estimated at $254,391, approximately $179 per square foot. 172 Tyler Ln is a home located in Carroll County with nearby schools including Mt. Zion Elementary School, Mt. Zion Middle School, and Mt. Zion High School.
Ownership History
Date
Name
Owned For
Owner Type
Purchase Details
Closed on
Apr 26, 2019
Sold by
Williams Robert D
Bought by
Chapman Kody I and Chapman Stevana B
Current Estimated Value
Home Financials for this Owner
Home Financials are based on the most recent Mortgage that was taken out on this home.
Original Mortgage
$105,469
Outstanding Balance
$91,761
Interest Rate
4%
Estimated Equity
$162,630
Purchase Details
Closed on
Feb 20, 2004
Sold by
Maxwell Billy F and Allumns Stev
Bought by
Williams Ii Robert D and Williams Erica B
Purchase Details
Closed on
Dec 22, 2003
Sold by
Bank Of New York As Trustee Fo
Bought by
Maxwell Billy F and Allumns Steven E
Purchase Details
Closed on
Aug 5, 2003
Sold by
Haralson Charles M
Bought by
Bank Of New York As Trustee For
Purchase Details
Closed on
Sep 1, 1998
Sold by
Robinson W W
Bought by
Haralson Charles M
Create a Home Valuation Report for This Property
The Home Valuation Report is an in-depth analysis detailing your home's value as well as a comparison with similar homes in the area
Home Values in the Area
Average Home Value in this Area
Purchase History
| Date | Buyer | Sale Price | Title Company |
|---|---|---|---|
| Chapman Kody I | $103,250 | -- | |
| Williams Ii Robert D | $106,600 | -- | |
| Maxwell Billy F | $74,200 | -- | |
| Bank Of New York As Trustee For | -- | -- | |
| Haralson Charles M | $81,500 | -- |
Source: Public Records
Mortgage History
| Date | Status | Borrower | Loan Amount |
|---|---|---|---|
| Open | Chapman Kody I | $105,469 |
Source: Public Records
Tax History
| Year | Tax Paid | Tax Assessment Tax Assessment Total Assessment is a certain percentage of the fair market value that is determined by local assessors to be the total taxable value of land and additions on the property. | Land | Improvement |
|---|---|---|---|---|
| 2025 | $2,480 | $86,124 | $7,800 | $78,324 |
| 2024 | $2,502 | $86,124 | $7,800 | $78,324 |
| 2023 | $2,502 | $79,058 | $7,800 | $71,258 |
| 2022 | $2,087 | $64,951 | $7,800 | $57,151 |
| 2021 | $1,855 | $56,746 | $7,800 | $48,946 |
| 2020 | $1,060 | $51,187 | $7,800 | $43,387 |
| 2019 | $1,049 | $47,894 | $7,800 | $40,094 |
| 2018 | $965 | $42,517 | $7,800 | $34,717 |
| 2017 | $968 | $42,517 | $7,800 | $34,717 |
| 2016 | $968 | $42,517 | $7,800 | $34,717 |
| 2015 | $921 | $36,919 | $5,200 | $31,719 |
| 2014 | $497 | $21,694 | $5,200 | $16,494 |
Source: Public Records
Map
Nearby Homes
- 142 Tyler Ln
- 0 Bremen Mount Zion Rd Unit 26904413
- 125 Bethlehem Church Rd
- 0 Bethlehem Church Rd Unit 7719552
- 0 Bethlehem Church Rd Unit 10691788
- 256 Tripp Ln
- 0 W Mandeville Rd Unit 10707210
- 0 W Mandeville Rd Unit 7732471
- 405 Adler Point
- 141 Anita Blvd
- 218 Randall Dr
- 206 Randall Dr
- 213 Randall Dr
- TBD Bremen Mount Zion Rd
- 0 Hog Liver Rd Unit 10721712
- 00 Hog Liver Rd Unit 346
- 0 Hog Liver Rd Unit 10630257
- 0 Hog Liver Rd Unit 7671087
- 0 Hog Liver Rd Unit 10614601
- 0 Hog Liver Rd Unit 10630818
- 180 Tyler Ln
- 166 Tyler Ln
- 156 Tyler Ln
- 181 Tyler Ln
- 168 Tyler Ln
- 263 Eagle Watch Dr
- 175 Tyler Ln Unit 11
- 175 Tyler Ln
- 257 Eagle Watch Dr
- 130 Tyler Ln
- 275 Eagle Watch Dr
- 176 Tyler Ln
- 245 Eagle Watch Dr
- 116 Tyler Ln
- 133 Tyler Ln
- 281 Eagle Watch Dr
- 266 Eagle Watch Dr
- 233 Eagle Watch Dr
- 100 Tyler Ln
- 115 Tyler Ln
Your Personal Tour Guide
Ask me questions while you tour the home.