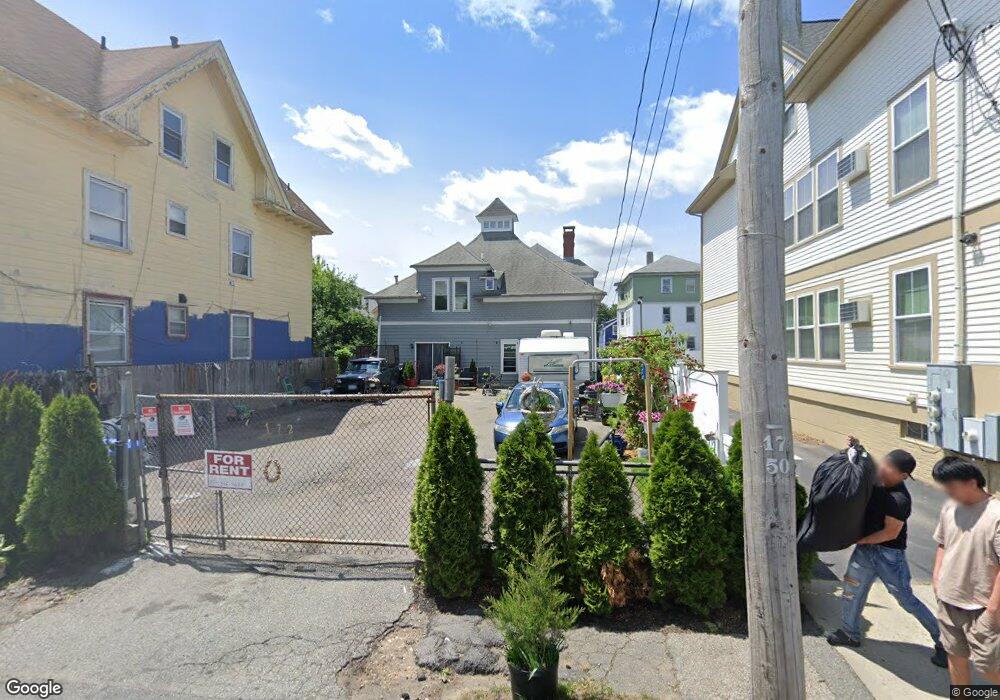
172 Waverly St Providence, RI 02909
West End NeighborhoodEstimated Value: $324,000 - $527,000
6
Beds
2
Baths
2,013
Sq Ft
$216/Sq Ft
Est. Value
About This Home
This home is located at 172 Waverly St, Providence, RI 02909 and is currently estimated at $433,934, approximately $215 per square foot. 172 Waverly St is a home located in Providence County with nearby schools including Asa Messer Elementary School, Charles N. Fortes Elementary School, and Alfred Lima Sr. Elementary School.
Ownership History
Date
Name
Owned For
Owner Type
Purchase Details
Closed on
Jul 11, 2024
Sold by
Ortega Edgar F
Bought by
Urizar Delmy A
Current Estimated Value
Purchase Details
Closed on
May 1, 2018
Sold by
Good Investments Llc
Bought by
Ortega Edgar F
Home Financials for this Owner
Home Financials are based on the most recent Mortgage that was taken out on this home.
Original Mortgage
$83,000
Interest Rate
3.9%
Mortgage Type
New Conventional
Purchase Details
Closed on
Mar 24, 2011
Sold by
White Karolye and Providence City Of
Bought by
Good Investments Llc
Purchase Details
Closed on
Jan 12, 2009
Sold by
Good Investments Llc
Bought by
Ft Investments Llc
Purchase Details
Closed on
Oct 30, 2008
Sold by
Us Bank Na
Bought by
Good Investments Llc
Purchase Details
Closed on
Oct 1, 2008
Sold by
Cabreja Cedar
Bought by
Us Bank Na
Purchase Details
Closed on
Nov 19, 2004
Sold by
Arias Pablo
Bought by
Cabreja Cesar
Purchase Details
Closed on
Jan 17, 2003
Sold by
Lopez Eduardo
Bought by
Arias Pablo
Purchase Details
Closed on
Oct 19, 2001
Sold by
Fage Robert
Bought by
Lopez Eduardo
Create a Home Valuation Report for This Property
The Home Valuation Report is an in-depth analysis detailing your home's value as well as a comparison with similar homes in the area
Home Values in the Area
Average Home Value in this Area
Purchase History
| Date | Buyer | Sale Price | Title Company |
|---|---|---|---|
| Urizar Delmy A | -- | None Available | |
| Urizar Delmy A | -- | None Available | |
| Ortega Edgar F | $125,000 | -- | |
| Ortega Edgar F | $125,000 | -- | |
| Good Investments Llc | $4,657 | -- | |
| Good Investments Llc | $4,657 | -- | |
| Ft Investments Llc | $105,000 | -- | |
| Ft Investments Llc | $105,000 | -- | |
| Good Investments Llc | $50,000 | -- | |
| Good Investments Llc | $50,000 | -- | |
| Us Bank Na | $252,097 | -- | |
| Us Bank Na | $252,097 | -- | |
| Cabreja Cesar | $206,000 | -- | |
| Cabreja Cesar | $206,000 | -- | |
| Arias Pablo | $100,000 | -- | |
| Arias Pablo | $100,000 | -- | |
| Lopez Eduardo | $84,000 | -- | |
| Lopez Eduardo | $84,000 | -- |
Source: Public Records
Mortgage History
| Date | Status | Borrower | Loan Amount |
|---|---|---|---|
| Previous Owner | Ortega Edgar F | $83,000 |
Source: Public Records
Tax History Compared to Growth
Tax History
| Year | Tax Paid | Tax Assessment Tax Assessment Total Assessment is a certain percentage of the fair market value that is determined by local assessors to be the total taxable value of land and additions on the property. | Land | Improvement |
|---|---|---|---|---|
| 2024 | $4,633 | $252,500 | $72,400 | $180,100 |
| 2023 | $4,633 | $252,500 | $72,400 | $180,100 |
| 2022 | $4,495 | $252,500 | $72,400 | $180,100 |
| 2021 | $3,556 | $144,800 | $34,300 | $110,500 |
| 2020 | $3,556 | $144,800 | $34,300 | $110,500 |
| 2019 | $3,556 | $144,800 | $34,300 | $110,500 |
| 2018 | $3,580 | $112,000 | $34,000 | $78,000 |
| 2017 | $3,580 | $112,000 | $34,000 | $78,000 |
| 2016 | $3,580 | $112,000 | $34,000 | $78,000 |
| 2015 | $3,257 | $98,400 | $34,000 | $64,400 |
| 2014 | $3,321 | $98,400 | $34,000 | $64,400 |
| 2013 | $3,321 | $98,400 | $34,000 | $64,400 |
Source: Public Records
Map
Nearby Homes