172 York Rd Mansfield, MA 02048
Estimated Value: $1,014,000 - $1,221,000
4
Beds
3
Baths
5,524
Sq Ft
$200/Sq Ft
Est. Value
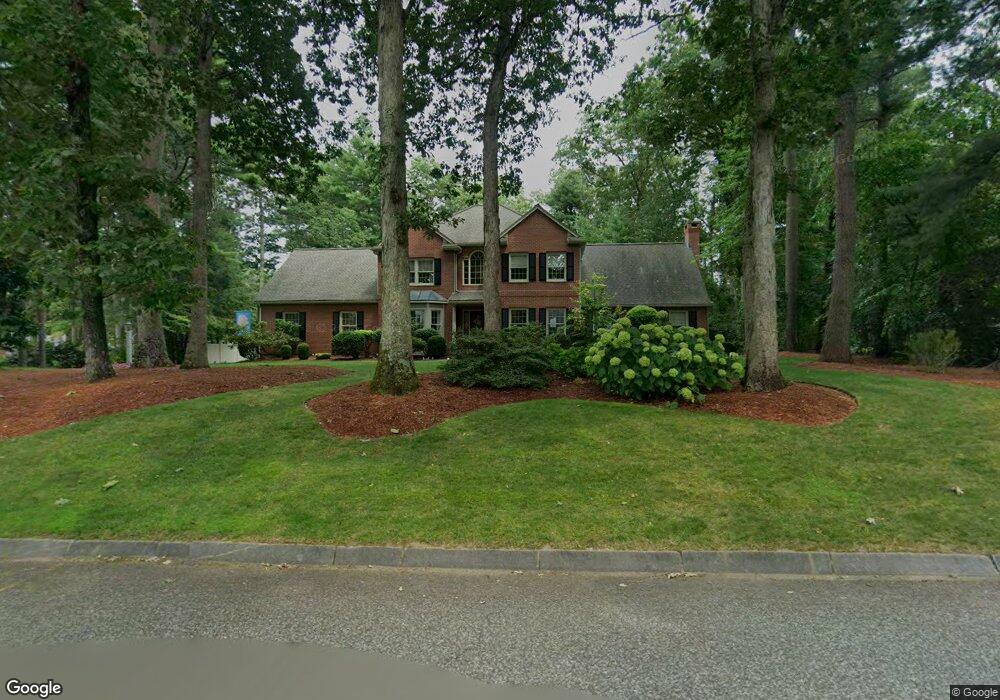
About This Home
This home is located at 172 York Rd, Mansfield, MA 02048 and is currently estimated at $1,106,600, approximately $200 per square foot. 172 York Rd is a home located in Bristol County with nearby schools including Everett W. Robinson Elementary School, Jordan/Jackson Elementary School, and Harold L. Qualters Middle School.
Ownership History
Date
Name
Owned For
Owner Type
Purchase Details
Closed on
May 14, 1999
Sold by
Dever Brian C and Dever Rosemary V
Bought by
Carey Paul T and Carey Kimberlee C
Current Estimated Value
Purchase Details
Closed on
Mar 31, 1992
Sold by
North Park Rt
Bought by
Dever Brian C and Dever Rosemary
Create a Home Valuation Report for This Property
The Home Valuation Report is an in-depth analysis detailing your home's value as well as a comparison with similar homes in the area
Home Values in the Area
Average Home Value in this Area
Purchase History
| Date | Buyer | Sale Price | Title Company |
|---|---|---|---|
| Carey Paul T | $372,500 | -- | |
| Carey Paul T | $372,500 | -- | |
| Dever Brian C | $83,000 | -- |
Source: Public Records
Mortgage History
| Date | Status | Borrower | Loan Amount |
|---|---|---|---|
| Open | Dever Brian C | $310,000 | |
| Closed | Dever Brian C | $325,000 | |
| Closed | Dever Brian C | $200,000 |
Source: Public Records
Tax History
| Year | Tax Paid | Tax Assessment Tax Assessment Total Assessment is a certain percentage of the fair market value that is determined by local assessors to be the total taxable value of land and additions on the property. | Land | Improvement |
|---|---|---|---|---|
| 2025 | $13,817 | $1,049,100 | $302,300 | $746,800 |
| 2024 | $12,636 | $936,000 | $266,100 | $669,900 |
| 2023 | $11,896 | $844,300 | $266,100 | $578,200 |
| 2022 | $11,338 | $747,400 | $246,300 | $501,100 |
| 2021 | $11,196 | $728,900 | $224,000 | $504,900 |
| 2020 | $10,995 | $715,800 | $224,000 | $491,800 |
| 2019 | $10,709 | $703,600 | $202,100 | $501,500 |
| 2018 | $10,672 | $685,400 | $192,700 | $492,700 |
| 2017 | $10,015 | $666,800 | $187,300 | $479,500 |
| 2016 | $9,702 | $629,600 | $185,100 | $444,500 |
| 2015 | $9,418 | $607,600 | $185,100 | $422,500 |
Source: Public Records
Map
Nearby Homes
- 24 Maverick Dr
- 85 Jewell St
- 78 Old Farm Rd
- 150 Gilbert St
- 14 Claire Ave
- 9 Coach Rd
- 52 White Oak Way
- 16 Treasure Island Rd
- 115 Westfield Dr
- 2 Oak St Unit 2A
- 2 Oak St Unit 2B
- 451R Gilbert St
- 49 Pheasant Hill Rd
- 57 Vine St
- 46 Mirimichi St
- 28 Messenger St
- 37 Oakleaf Dr
- Lot 5 Jeffrey Dr
- Lot 2 Jeffrey Dr
- 152 Central St