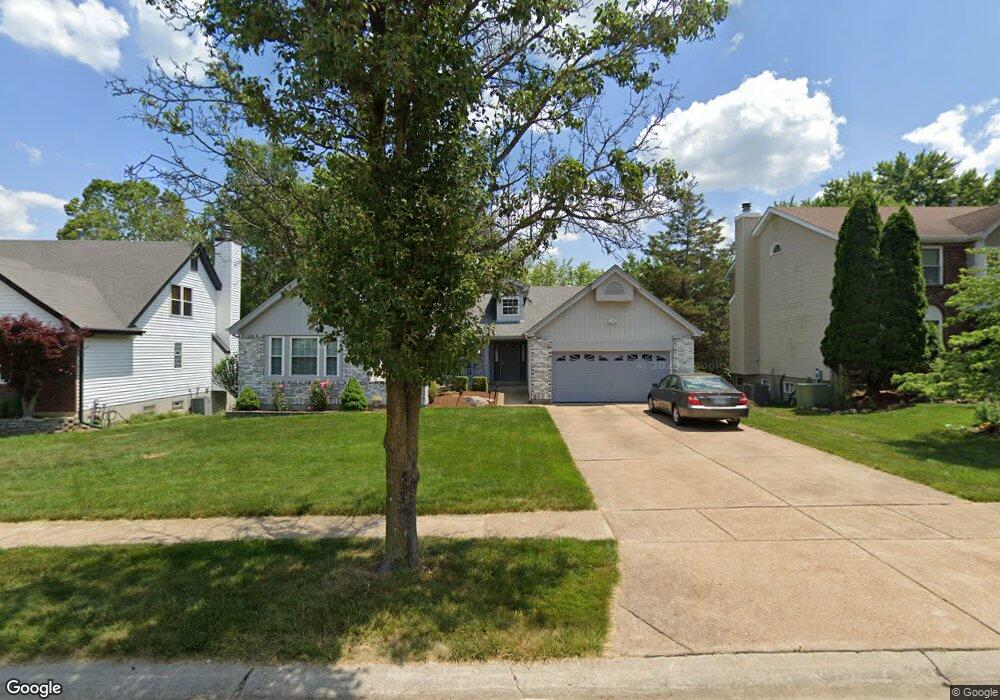
1720 Coronita Dr Fenton, MO 63026
Estimated Value: $460,412 - $539,000
4
Beds
3
Baths
2,247
Sq Ft
$226/Sq Ft
Est. Value
About This Home
This home is located at 1720 Coronita Dr, Fenton, MO 63026 and is currently estimated at $506,853, approximately $225 per square foot. 1720 Coronita Dr is a home located in St. Louis County with nearby schools including Uthoff Valley Elementary School, Rockwood South Middle School, and Rockwood Summit Senior High School.
Ownership History
Date
Name
Owned For
Owner Type
Purchase Details
Closed on
Jul 27, 2021
Sold by
Seifert Christine M and Wolz Christine
Bought by
Wolz Christine
Current Estimated Value
Home Financials for this Owner
Home Financials are based on the most recent Mortgage that was taken out on this home.
Original Mortgage
$185,000
Outstanding Balance
$174,336
Interest Rate
3%
Mortgage Type
New Conventional
Estimated Equity
$332,517
Purchase Details
Closed on
Jun 1, 2011
Sold by
James Jerry R and James Janice K
Bought by
Seifert Christine M
Home Financials for this Owner
Home Financials are based on the most recent Mortgage that was taken out on this home.
Original Mortgage
$172,500
Interest Rate
4.85%
Mortgage Type
New Conventional
Purchase Details
Closed on
Oct 25, 2004
Sold by
James Janice K
Bought by
James Jerry R and James Janice K
Purchase Details
Closed on
Jun 30, 2000
Sold by
James Jerry R and James Janice K
Bought by
Revocable Living Trust Of Janice K James
Create a Home Valuation Report for This Property
The Home Valuation Report is an in-depth analysis detailing your home's value as well as a comparison with similar homes in the area
Home Values in the Area
Average Home Value in this Area
Purchase History
| Date | Buyer | Sale Price | Title Company |
|---|---|---|---|
| Wolz Christine | -- | Title Partners Agency Llc | |
| Seifert Christine M | $267,500 | Ust | |
| James Jerry R | -- | -- | |
| Revocable Living Trust Of Janice K James | -- | -- |
Source: Public Records
Mortgage History
| Date | Status | Borrower | Loan Amount |
|---|---|---|---|
| Open | Wolz Christine | $185,000 | |
| Closed | Seifert Christine M | $172,500 |
Source: Public Records
Tax History Compared to Growth
Tax History
| Year | Tax Paid | Tax Assessment Tax Assessment Total Assessment is a certain percentage of the fair market value that is determined by local assessors to be the total taxable value of land and additions on the property. | Land | Improvement |
|---|---|---|---|---|
| 2025 | $5,670 | $84,110 | $27,850 | $56,260 |
| 2024 | $5,670 | $76,550 | $17,400 | $59,150 |
| 2023 | $5,670 | $76,550 | $17,400 | $59,150 |
| 2022 | $5,432 | $68,420 | $15,680 | $52,740 |
| 2021 | $5,390 | $68,420 | $15,680 | $52,740 |
| 2020 | $5,396 | $65,850 | $13,050 | $52,800 |
| 2019 | $5,412 | $65,850 | $13,050 | $52,800 |
| 2018 | $4,961 | $57,930 | $12,180 | $45,750 |
| 2017 | $4,921 | $57,930 | $12,180 | $45,750 |
| 2016 | $4,253 | $50,560 | $12,180 | $38,380 |
| 2015 | $4,165 | $50,560 | $12,180 | $38,380 |
| 2014 | $4,070 | $48,180 | $7,580 | $40,600 |
Source: Public Records
Map
Nearby Homes
- 1107 Coronita Way
- 1575 Uthoff Dr
- 2209 Fenway Farms Trail
- 1808 Dover Trace Dr
- 1710 Stemwood Way
- 1702 Stemwood Way
- 1719 Chestnut Farms Ct
- 82 May Valley Ln
- 683 Greenholme Ct
- 678 Greensleeves Dr
- 732 Deer Vue Ln
- 1851 Hawkins Place
- 2017 Brutus Ct
- 1818 Charles Thomas Ln
- 1655 Valley Park Rd
- 1881 San Pedro Ln
- 1883 San Lucas Ln
- 168 Majestic Dr
- 300 Imperial Ln
- 161 Majestic Dr
- 1716 Coronita Dr
- 1724 Coronita Dr
- 1712 Coronita Dr
- 1728 Coronita Dr
- 1717 Coronita Dr
- 1721 Coronita Dr
- 1708 Coronita Dr
- 1713 Coronita Dr
- 1725 Coronita Dr
- 1732 Coronita Dr
- 1709 Coronita Dr
- 1733 Coronita Dr
- 1704 Coronita Dr
- 1262 Fenton Meadow Ct
- 1266 Fenton Meadow Ct
- 1270 Fenton Meadow Ct
- 1029 Villa Gran Way
- 1037 Villa Gran Way
- 1274 Fenton Meadow Ct
- 1258 Fenton Meadow Ct