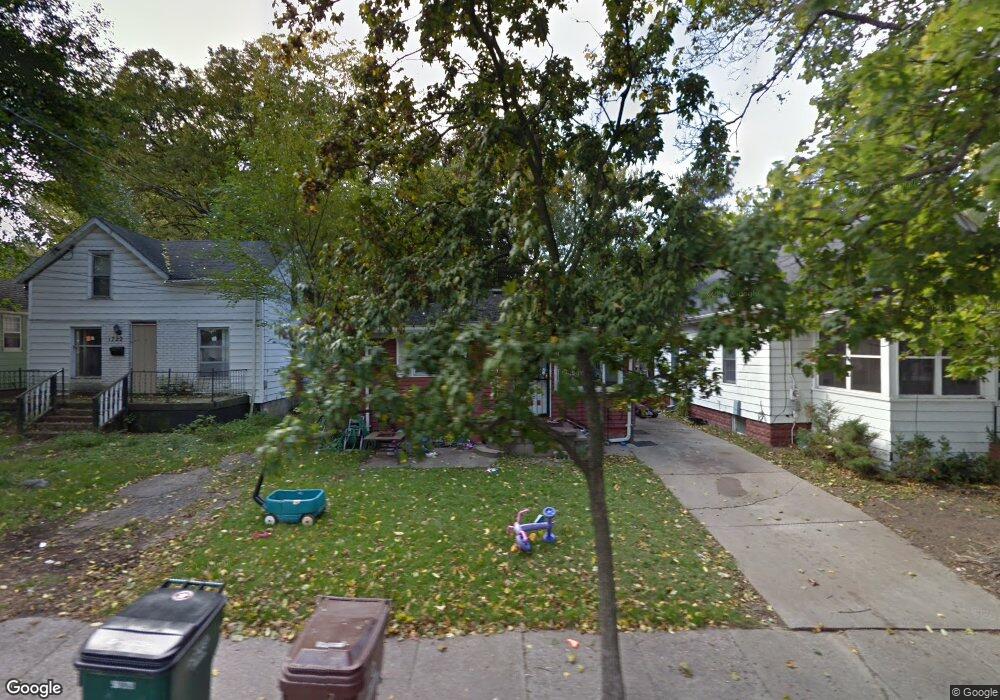
1720 Donora St Lansing, MI 48910
Fabulous Acres NeighborhoodEstimated Value: $98,000 - $109,000
3
Beds
1
Bath
864
Sq Ft
$119/Sq Ft
Est. Value
About This Home
This home is located at 1720 Donora St, Lansing, MI 48910 and is currently estimated at $102,934, approximately $119 per square foot. 1720 Donora St is a home located in Ingham County with nearby schools including Lyons Elementary School, Pattengill Academy, and Eastern High School.
Ownership History
Date
Name
Owned For
Owner Type
Purchase Details
Closed on
Dec 6, 2012
Sold by
Thor Real Estate Llc
Bought by
Stone Anthony Jerome
Current Estimated Value
Purchase Details
Closed on
Jan 12, 2009
Sold by
Lender Asset Resolution Inc
Bought by
Lakes Management Llc
Purchase Details
Closed on
Oct 31, 2008
Sold by
Hsbc Bank Usa Na
Bought by
Lender Asset Resolution Inc
Purchase Details
Closed on
Dec 27, 2007
Sold by
Amon Jeffrey A and Kelley Joan
Bought by
Hsbc Bank Usa Na and Nomura Home Equity Loan Inc Asset Backed
Purchase Details
Closed on
Sep 14, 2006
Sold by
Estate Of Mary E Lucas
Bought by
Amon Jeffery A and Kelley Joan
Home Financials for this Owner
Home Financials are based on the most recent Mortgage that was taken out on this home.
Original Mortgage
$62,040
Interest Rate
10.25%
Mortgage Type
Purchase Money Mortgage
Create a Home Valuation Report for This Property
The Home Valuation Report is an in-depth analysis detailing your home's value as well as a comparison with similar homes in the area
Home Values in the Area
Average Home Value in this Area
Purchase History
| Date | Buyer | Sale Price | Title Company |
|---|---|---|---|
| Stone Anthony Jerome | $5,500 | None Available | |
| Lakes Management Llc | -- | None Available | |
| Lender Asset Resolution Inc | -- | None Available | |
| Hsbc Bank Usa Na | $67,206 | None Available | |
| Amon Jeffery A | $77,550 | Fatic |
Source: Public Records
Mortgage History
| Date | Status | Borrower | Loan Amount |
|---|---|---|---|
| Previous Owner | Amon Jeffery A | $62,040 |
Source: Public Records
Tax History
| Year | Tax Paid | Tax Assessment Tax Assessment Total Assessment is a certain percentage of the fair market value that is determined by local assessors to be the total taxable value of land and additions on the property. | Land | Improvement |
|---|---|---|---|---|
| 2025 | $1,719 | $44,000 | $4,300 | $39,700 |
| 2024 | $9 | $34,000 | $4,300 | $29,700 |
| 2023 | $1,085 | $30,400 | $4,300 | $26,100 |
| 2022 | $984 | $28,100 | $3,600 | $24,500 |
| 2021 | $964 | $25,100 | $3,500 | $21,600 |
| 2020 | $957 | $23,700 | $3,500 | $20,200 |
| 2019 | $1,555 | $21,600 | $3,500 | $18,100 |
| 2018 | $861 | $19,300 | $3,500 | $15,800 |
| 2017 | $823 | $19,300 | $3,500 | $15,800 |
| 2016 | $1,382 | $19,000 | $3,500 | $15,500 |
| 2015 | $1,382 | $18,500 | $6,941 | $11,559 |
| 2014 | $1,382 | $18,300 | $5,339 | $12,961 |
Source: Public Records
Map
Nearby Homes
- 1718 Donora St
- 1731 Lyons Ave
- 616 Isbell St
- 704 Mckim Ave
- 1535 Linval St
- 1437 Ada St
- 1515 Linval St
- 534 Isbell St
- 2201 S Pennsylvania Ave
- 2118 Roberts Ln
- 1423 Pontiac St
- 1501 Shubel Ave
- 2215 Alpha St
- 1731 Herbert St
- 506 Christiancy St
- 2340 S Pennsylvania Ave
- 315 E Mount Hope Ave
- 147 Isbell St
- 1807 Teel Ave
- 0 E Mount Hope Ave
Your Personal Tour Guide
Ask me questions while you tour the home.